My Swing Trading Approach
Currently, I am 100% cash and will stay that way, until there is a definable edge in this market.
Indicators
Industries to Watch Today
Utilities were the only sector to finish in positive territory. Its chart though is not one that I would consider bullish though. Technology finally broke down yesterday. All other sectors are rolling over.
My Market Sentiment
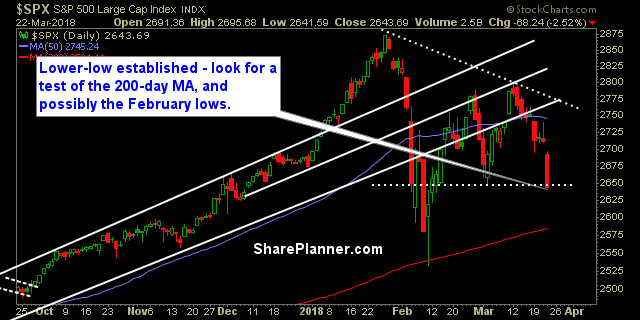
A double top pattern formed in February and March confirmed and a lower-low confirmed as well. Very bearish chart for the market at this juncture.
S&P 500 Technical Analysis

Current Stock Trading Portfolio Balance


Leave A Comment