Indian share markets witnessed selling pressure in the afternoon session amid mixed Asian markets. At the closing bell, the BSE Sensex closed lower by 150 points and the NSE Nifty finished lower by 60 points.
The S&P BSE Mid Cap finished up by 0.5% while S&P BSE Small Cap finished up by 0.8%. Losses were largely seen in FMCG stocks, oil & gas stocks and metal stocks.
We generally refer to PE or price to earnings ratio to gauge whether the market is undervalued or overvalued. If we go by this ratio, the Indian market is clearly in overvaluation territory.
There is still another ratio, which is frequently used to evaluate the valuations. The market capitalization to GDP ratio. It is one of Buffett’s favorite indicators of broader market value. The market cap of all the listed companies in the country divided by the gross domestic product (GDP) of the country gives us this ratio.
Market Cap to GDP Ratio Close to 100%
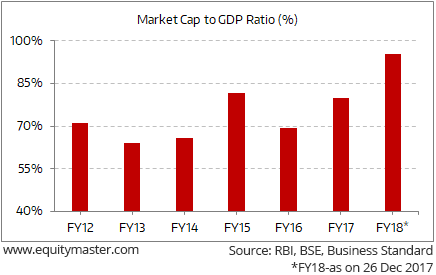
The idea behind this ratio is simple. Stock prices are derived from expected earnings for corporates and GDP represents revenue of the country. This gives investors an estimate of whether the two are moving in tandem. A ratio above 100% shows overvaluation and one below 50% shows that the market may be undervalued.
Even this ratio is showing valuations reaching its peak levels. India’s market cap to GDP ratio reached 95%. This ratio was more than 100% after the 2007 bull run. Stock prices had seen a significant meltdown after that amid the global financial crisis.
Asian stock markets finished mixed as of their recent closing prices. The Hang Seng gained 0.34% while the Nikkei 225 was higher by 0.12%. The Shanghai Composite was even. European markets are higher today with shares in Germany leading the region. The DAX is up 0.76% while France’s CAC 40 is up 0.54% and London’s FTSE 100 is up 0.26%.




Leave A Comment