The gold to silver ratio has been used for years to indicate buy and sell zones in both gold and silver. Why?
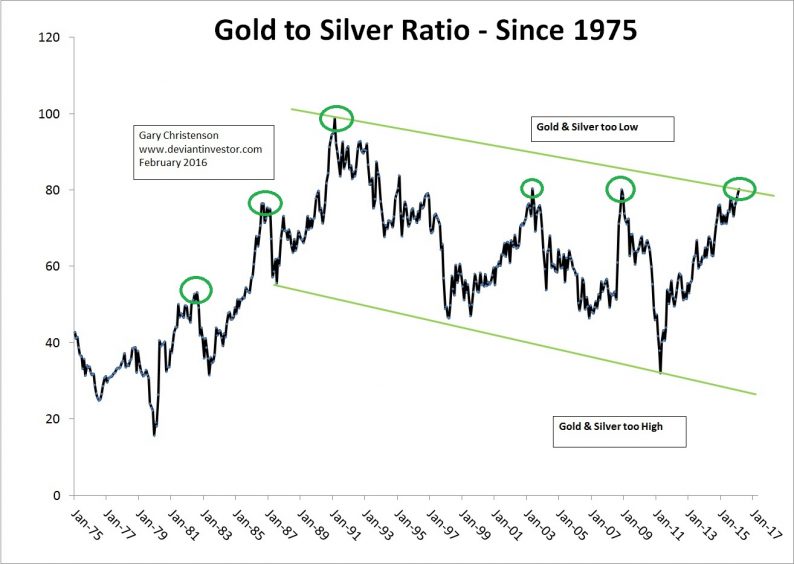
Examine the following graph of the gold to silver ratio (monthly data) for the past 40 years. I have circled the six most extreme highs in the ratio with green ovals.

At 5 of 6 extremes in the ratio silver was at or near a long term bottom. The one minor exception was when silver bottomed in November of 2001 at $4.01 and the ratio peaked later in May 2003. Otherwise the ratio was quite accurate at indicating major silver lows.
For more confirmation, assume a silver buy signal occurs when an extreme in the gold to silver ratio has been reached, and the weekly silver price closes above its 5 week moving average.
Monthly Ratio Extremes Silver (weekly) closes above
(green ovals above) 5 week MA
June 1982 July 2, 1982
August 1986 September 5, 1986
February 1991 March 8, 1991
May 2003 April 11, 2003


Leave A Comment