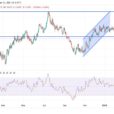
The S&P 500 (SPX), the Dow Jones Industrial Average (DJIA) and most indices closed in the red on Friday. Since February 1st, markets experienced a rather volatile period and it was no exception for both the S&P 500 (SPX) and the Dow Jones Industrial Average (DJIA).
Our article today will look into why Both the S&P 500 and the Dow Jones Industrial Average are down and most important, what are the crucial support levels investors should watch for.
SPX and DJIA Down, what triggered the drop?
Stocks had a strong start in 2018, and just as investors were getting more and more complacent, a first market correction hit in a quick and unexpected way. In retrospect, complacency describes best the sentiment in the market towards the end of 2017 and the start of 2018. Back then, when we wrote about the potential correction in the stock market and warned specifically about the general complacency we noticed, it seemed like it was impossible for the rally in the American markets to stop let alone a correction to happen. Two months ago, we also noticed how the Home Construction industry was correcting:Watch Out Below. Is The Home Construction Sector Eyeing This Support Level?
Yet the market correction happened, not in correction in the stock market. As markets started recovering, the market took, again, another abrupt turn. Financial news was quick to point out the rising yield as the main factor that spooked investors. Later on, they pointed towards the announcement of “Trump tariffs” on imported steel and aluminium. A few days ago, the fear in the market was driven by concerns over a potential trade war with China whom vowed to slap the equivalent tariff on US exports.
SPX and DJIA: The real story is in the charts
If our warning of a potential quick crash in SPX in 2018 went unnoticed, for the past two weeks, we have been receiving countless emails and requests to assess the impact of the recent markets movements in the stock market and indices as a whole. This article today seeks to educate investors on important price levels to watch for if indices continue to head south.


Leave A Comment