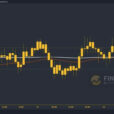
VIX surged past the weekly Cycle Top at 22.74, closing the week with a buy signal. The next Cycle Top may exceed the prior high in the next 1-2 weeks.
(ZeroHedge) Just two weeks ago, everything was awesome: jobs data was perfectly ‘Goldilocks’, stocks surged, banks loved it, and VIX flash-crashed lower – normalizing the term structure. Today… things are very different. The market has given up on Goldilocks.
SPX breaks the 2-year Trendline
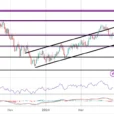
SPX declined through the lower Ending Diagonal trendline, stopping at Long-term support at 2583.02. While it may bounce on Monday, the Cycles Model suggests that SPX has a date with a major Cycle Bottom in the next week or two. The broken trendline suggests that the entire two-year rally may be retraced in that time.
(CBSNews) Stocks tumbled to their lowest levels since November amid fears of a U.S.-China trade war and concerns that higher interest rates could put the brakes on growth.
The Dow Jones Industrial Average declined 423.69 points, or 1.8 percent, to 23,533.20 on Friday. That followed a steep decline on Thursday, and pushes the Dow into correction territory, which is a decline of more than 10 percent from its 52-week high. The S&P 500 index slumped 2 percent on Friday, while the tech-heavy Nasdaq Composite index declined 2.4 percent.
NDX makes a hard reversal off the top
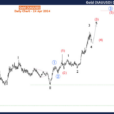
The NDX sold off from its Cycle Top at 6992.08, breaking through Short-and-Mid-term support and leaving a bearish Island Reversal. It is on a confirmed sell signal. The 2-year Diagonal trendline is the next target. Breaking through that, it is possible to decline to the Cycle Bottom at 3756.37 in short order.
(TheStreet) Stocks slumped this week after Donald Trump reignited fears of a trade war by announcing tariffs on Chinese imports, and several of the top tech giants fell even more sharply.
The S&P 500, Dow Jones Industrial Average and the Nasdaq each fell around 6% this week, while Facebook Inc.(FB) , Apple Inc.(AAPL) and Alphabet Inc.(GOOGL) all declined even more. Facebook had a particularly rough week after news came to light that a data breach in 2014 allowed the data analytics firm Cambridge Analytica to harvest the data of as many as 50 million users.
“When the market goes down, the best-performing stocks go down more,” Wedbush analyst Michael Pachter said.
High Yield Bond Index declined through Long-term support
The High Yield Bond Index broke through the 2-year Diagonal trendline and Long-term support at 182.66 as suggested last week. A broken Diagonal trendline infers a complete retracement to its origin. This may happen in a very short period of time.
(ZeroHedge) It’s time for JPMorgan to start worrying again that retail investors are no longer buying the f—ing dip (as it did three weeks ago).
Just one week after Bank of America was “stunned” by record inflows into equities, this week everything went in reverse, following the latest Facebook-inspired sharp drop in stocks which brought the market back to the verge of a correction. The result was a “huge” $19.9 billion equity outflows, with the $18.6 billion in ETF outflows the second highest ever according to BofA.
UST emerges above Cycle Bottom support
The 10-year Treasury Note Index consolidated in a sideways fashion, bouncing from its Cycle Bottom support at 119.88 to test Short-term resistance at 120.54. A breakout above resistance may help the bullish case for UST. Wednesday’s low at 119.92 may have been a Master Cycle low with a probable 2-3 weeks of rally to follow. A likely target may be the Head & Shoulders neckline near 123.00.


Leave A Comment