
The crypto ship is sailing in rough seas at the moment. My advice? Stay away for now. Preserve your capital for after the major crash, and then pick winners from the bones.
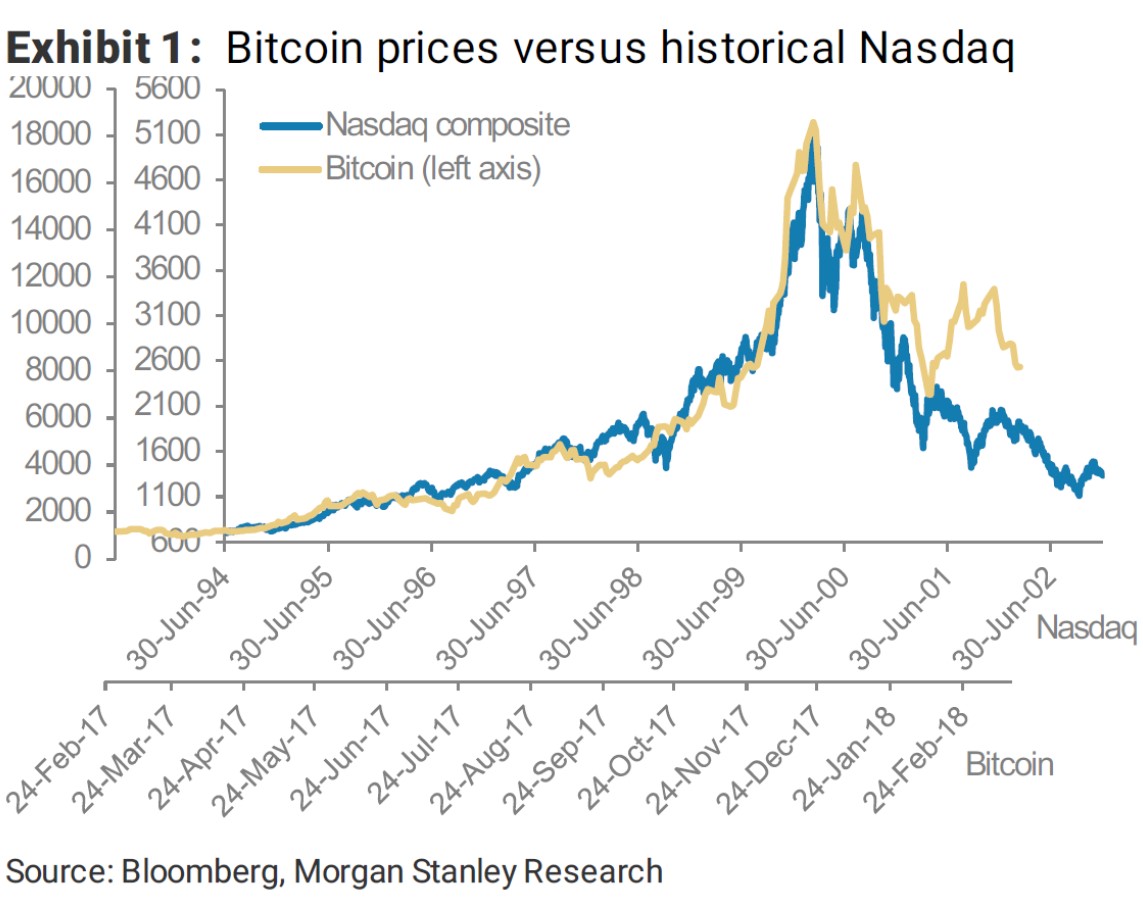
The Bitcoin and cryptocurrency trends seem to be following the path the internet took back in the very late 1990s. That bubble came at the end of the tech bubble and expanded by more than 8 times between late 1998 and early 2000. Then it crashed 93%.
Bitcoin has come at the end of the second tech and internet bubble.
It has been up by more than 20 times since late 2016.
And so far, it’s crashed 70% in a little more than two months.
As I was writing this, this Morgan Stanley Research (courtesy of Bloomberg Technology) chart popped into my inbox. Pretty telling…
But that’s not all…
Bitcoin has bubbled up three times now. Once into 2011, again into 2013, and into 2017 as well.
It went up 59 times, going from $0.05 to $29.50 between July 22, 2010, and June 8, 2011, and then it crashed 93% into November 18, 2011 – just five months.
Michael Terpin, who spoke at our Irrational Economic Summit in Nashville last year, and who has created a nine-part cryptocurrency mastery course that will be available to you soon, spoke about being in bitcoin when it was just $0.10.
Bitcoin bubbled again when it went up by 561 times, from $2.05 to $1,329 from November 18, 2011, to December 4, 2013. From there, it crashed 86% into January 14, 2015.
During this latest bubble, it’s gone up 122 times, and over 20 times in just the last year when it bubbled the most.
So, a 90%-plus crash this time around seems highly likely.
The worst-case scenario is that it crashes back to the late 1996 lows (where the bubble really started), between $800 and $1,000. That’s a loss of 95% to 96%… a slightly greater loss than the dot-com crash because bitcoin has bubbled more and faster. In fact, the bitcoin and cryptocurrency bubble has now exceeded even the extreme tulip bubble of 1635 – 1636.


Leave A Comment