
End Of The Yield Curve Flattening Period Treats Stocks Well
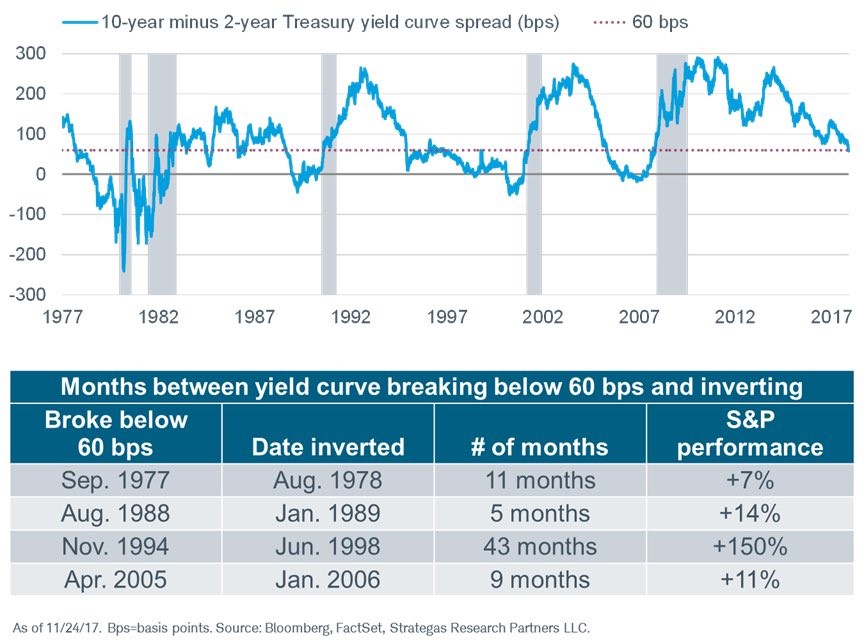
In continuation with our discussion about what the flattening yield curve means for stocks, the chart below shows the historical movements in the S&P 500 when the yield curve falls below 60 basis points. Firstly, you can see that the time it takes to invert once it goes below 60 basis points has varied widely. I have been discussing the possibility of it inverting sometime in late 2018 or early 2019, but that’s not close to a sure bet. As you can see, it took 43 months to invert after it went below 60 basis points in November 1994. Considering the fact that this is an elongated business cycle like the one in the 1990s, a delayed inversion wouldn’t be shocking.
The final column shows the S&P 500’s performance after the yield curve falls below 60 basis points. As you can see, the performance is mostly good. It’s important to annualize the performance because each length of time is different. The 1970s period had a 7.64% annualized return; the 1980s market had a 33.60% annualized gain; the 1990s period had a 41.86% gain; and the 2000s market had a 14.67% gain. The average annualized gain is 24.44% which is much higher than the average yearly gain overall. That doesn’t mean the next few quarters will have a big rally, but it’s worth noting the potential gains that could be had. Keep in mind, the median S&P 500 return in the past 6 flattening periods from 100 basis points to 0 was 6.6%.
What Does The Low Volatility Mean?
As I showed in a previous article, the VIX is at unprecedented levels as it has stayed below 10 for way longer than ever before. Add in the fact that this is the longest stretch without a 3% correction ever and it’s safe to say this is one of the calmest markets ever. The obvious follow up question to that is what it means for next year’s returns. 2013 was relatively quiet and it was followed by a good year. The table below reviews the years with the smallest max drawdowns along with the performance the following year. As you can see, the years following the low volatility years were not great as the average max drawdown is -12% and the average return is 5%. In the following year, the volatility is near the average, but the performance is worse.


Leave A Comment