While I dipped my toes to the short side during the month of March, I didn’t nearly capitalize as much as I could have that month.
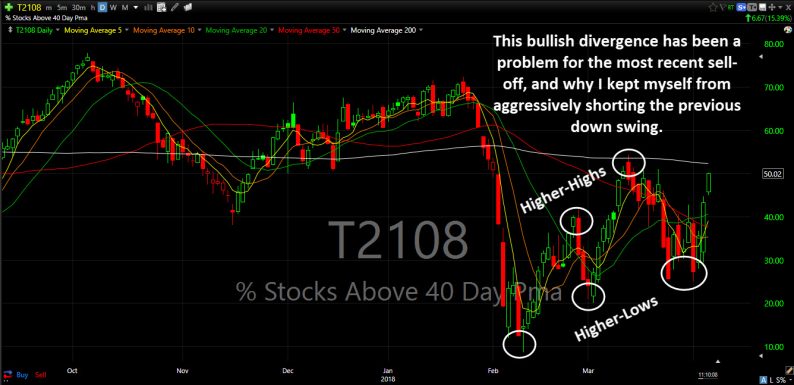
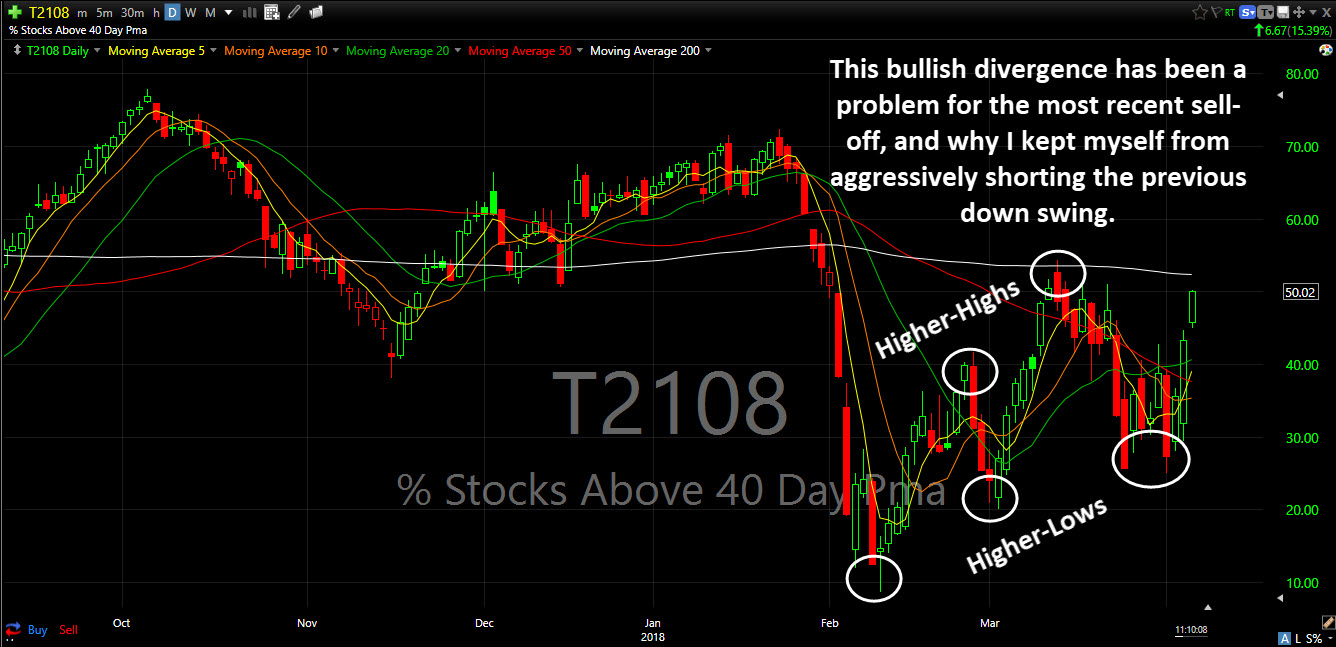
That is because of this T2108 chart, which measures the percentage of stocks trading above their 40-day moving average.
Despite to successive months of selling, the T2108 shows that 50% of stocks are now trading above that 40-DMA. That is really impressive, considering this is only the third day of the market bounce. Every time I looked into taking a substantial short position on this market over the last two weeks, I would look at this chart, and it showed that the fear that we saw in February, simply was not present in March or on the first day of April. You also had higher-highs and higher lows that were firmly in place, and when you see that much of a divergence to price, it is worth respecting.
Right now, the shorts are covering their positions, but that doesn’t mean they won’t, at some point, try to re-short this market. So you have to be aware, and make sure you are raising your stop-losses along the way.
Here’s the T2108


Leave A Comment