T2108 Status: 52.1%
T2107 Status: 55.3%
VIX Status: 15.0
General (Short-term) Trading Call: bearish
Active T2108 periods: Day #64 over 20%, Day #63 over 30%, Day #60 over 40%, Day #57 over 50% (overperiod), Day #2 under 60% (underperiod), Day #9 under 70%
Commentary
May 10, 2016 may be the closest the stock market gets to overbought status for a good while to come.
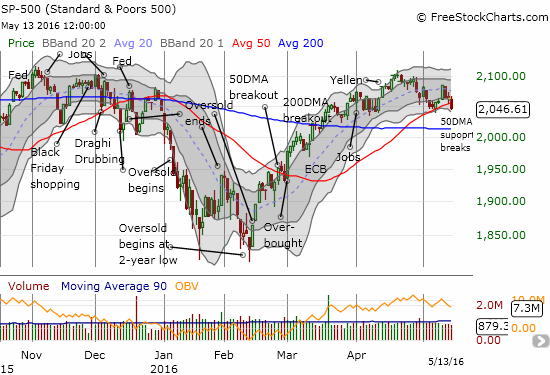
In the last T2108 Update, I noted how a jump in T2108 toward overbought status (to 66.8%) solidified the case of buyers. The S&P 500 (SPY) gained 1.3% on a day that looked like convincing follow-through to the line in the sand buyers drew at 50-day moving average (DMA) support. However, buyers did not follow-through from there. After three days of selling, the index has slipped under 50DMA support. The selling has also confirmed 50DMA resistance for the NASDAQ (QQQ).
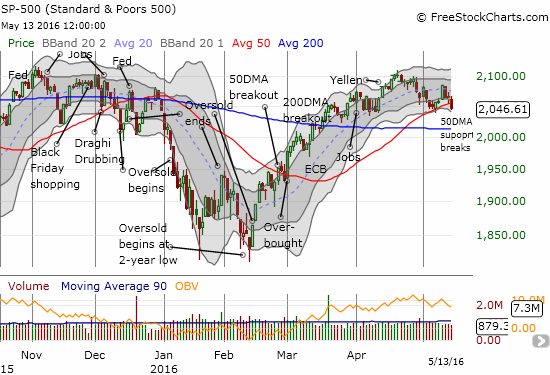
The S&P 500 breaks down below 50DMA support

The NASDAQ confirms 50DMA resistance. The 200DMA is also confirmed as resistance given it has converged on top of the 50DMA.
The S&P 500 closed essentially flat with the price level where buyers successfully defended 50DMA support in the previous week. So one might wonder why this 50DMA breakdown is alarming. This is a perfect situation for T2108, the percentage of stocks trading above their respective 40DMAs, to reveal the real underlying story. T2108 plunged to a 3+ month low in a move that resumes a downtrend that started in late April. T2108 closed at 52.1%, 4 percentage points below its low when buyers defended the S&P 500’s 50DMA. In other words, while the S&P 500 is fighting to stay level, stocks in general are failing to keep up: this divergence firms up my bearishness.
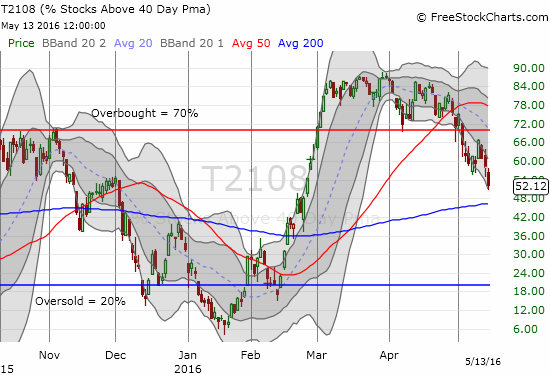
T2108 is slipping and slipping fast…
T2107, the percentage of stocks trading above their respective 200DMAs, closed at 55.3%. T2107 is still trying to hang in there.
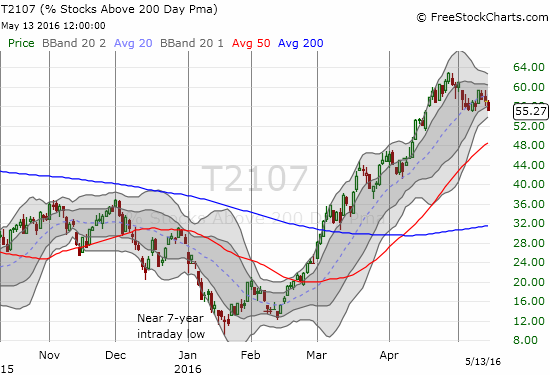
T2107 has not quite broken down to new recent lows, so it is not as bearish as T2108.
The volatility index, the VIX, is also trying to keep hope alive for buyers and bulls. The VIX is still not making major moves upward and has not (yet?) broken out above the 15.35 pivot line.

Back to the pivot line for the VIX
There are a stark set of charts that say loud and clear that the nature of trading has taken on a definitive bearish tone. T2108, the major indices, and charts like these explain why I have shifted my short-term trading bias from “cautiously bearish” to just plain ol’ “bearish.”


Leave A Comment