The first quarter of 2018 provided some long overdue volatility to equity markets while Treasury yields rose across the board. The long end of the yield curve underperformed during the month of January. Roughly 75% of the 35-basis-point move upward in the 30yr Treasury yield took place in the first month of the quarter, while the short end lagged the upward movement in yield. After experiencing steepening in January, the Treasury market reverted to a flattening trend as T-Bills and short-term Treasuries experienced the majority of their movement upward during the months of February and March, providing outperformance for the long end of the yield curve in those months.
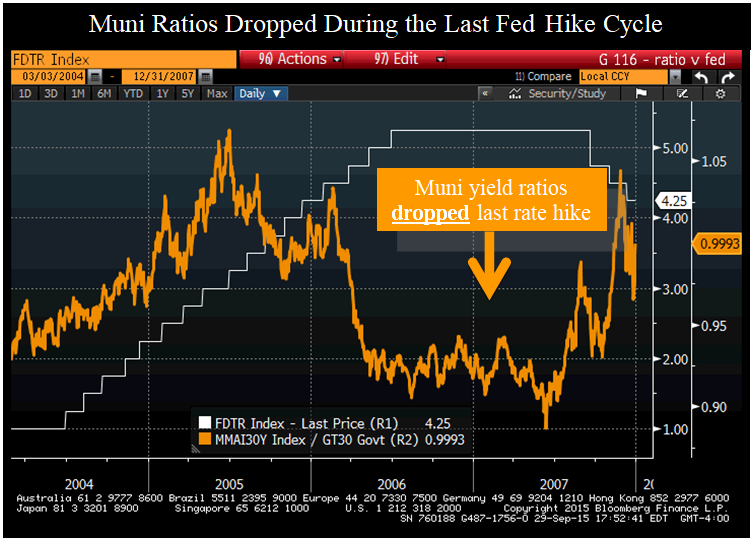
This outperformance on the long end of the yield curve over the last two months demonstrates why we favor a “barbell” approach and maintain an allocation to longer-dated securities. While the weighting is small at this time, we are currently targeting new-issue longer taxable and tax-free municipals that have either an attractive spread over Treasuries (taxable) or an attractive muni/Treasury ratio in the 125–140% range (tax-free munis). New issues tend to offer a concession to the secondary market to ensure deals get done and provide a cushion against the increase in rates we have been experiencing. The chart below shows why we think the inclusion of tax-free municipals is beneficial to taxable portfolios in light of our expectation that the muni/Treasury ratio will correct itself as we move forward with the Fed hiking cycle.

Source: Bloomberg
On the short end of the barbell, we continue to maintain the defensive assets we started purchasing at the beginning of the Fed’s hiking cycle. They include Treasury floating-rate notes, agency multi-steps, and T-bills that, as they mature, we will look to replace them or reinvest the proceeds in better-yielding opportunities, depending on market conditions. We have also started to include a heavier weighting in investment-grade corporate bonds on the short end of the barbell as spreads have started to widen in that space. The Bloomberg Barclays US Corporate Index OAS hit its tightest level since 2007 on 2/1/2018 at +85 before widening out to +105 currently. In contrast, taxable municipals have not experienced this level of widening, creating an opportunity to allocate more cash to short-term corporate bonds. The chart below shows the change in the Bloomberg Barclays US Corporate Index OAS so far in 2018.


Leave A Comment