

Last week, we started into an exploration of various technical indicators with “What Exactly Is RSI.” This week, I want to continue our exploration into the signals that we most often discuss in our “Technically Speaking” posts and in our weekly Real Investment Reports.
As I wrote, technical analysis is often dismissed by investors for three reasons:
There is no “one method” of technical analysis that works for everyone. Every technician uses different methods, indicators, and time-frames for their own analysis. Much depends on your personal investment time frame, risk tolerance and investing behavior.
This article is the second in the series to discuss some of the more common technical indicators we use in our own portfolio management practice and how we apply them.
Today, we will continue our journey with the standard-deviation as measured with “Bollinger Bands,” and “reversions to the mean.”
For Every Buyer, There Is A Seller
I am often asked that since there is “always a buyer for every seller,” then how can a market become overbought?
Before we get into the raw technical analysis of showing the “overbought” condition let’s rationalize what one is and how it occurs.
While it is true there is a buyer and seller in every transaction, it is the “supply and demand” of those participants which determines the price. Let me explain.
Imagine two rooms of 100 individuals each that want to buy shares of ABC stock. Room A has 100 individuals that currently own ABC stock and Room B has 100 individuals with cash wanting to buy shares of ABC. The table below shows a very simplified model of this process.
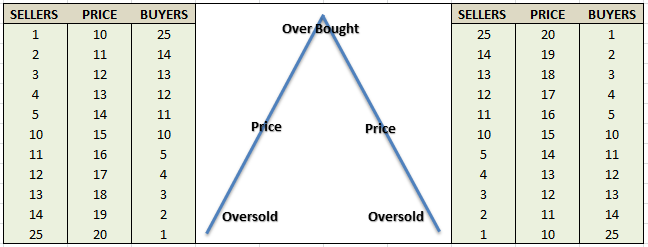
At $10 a share, there are numerous buyers but sellers are few. The demand for the shares drives the price higher which entices more sellers. As long as the demand for shares outpaces the supply of sellers – the price is pushed higher. However, at some point, the price reaches a level that exhausts the supply of buyers. The next price decline occurs as sellers have to begin lowering prices to find buyers.
So, “Yes”, for every buyer there is a seller, but the question is always at “what price?” Since price is determined by the “supply/demand imbalance,” it is only logical that by using historical prices investors can determine what “price” buyers and sellers have previously been most active. Hence, the determination of both “overbought” or “oversold” conditions.


Leave A Comment