In my post of January 8, 2012, there was much talk of a potential recession coming to Canada.
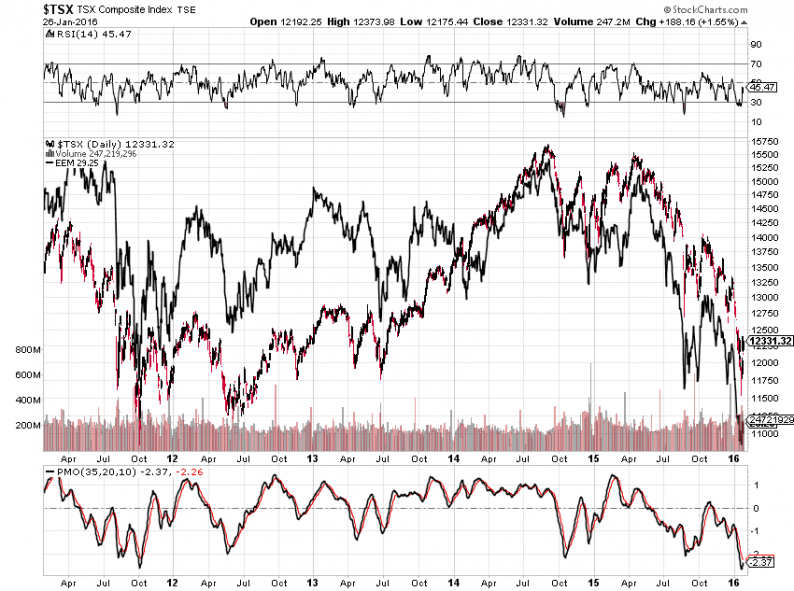
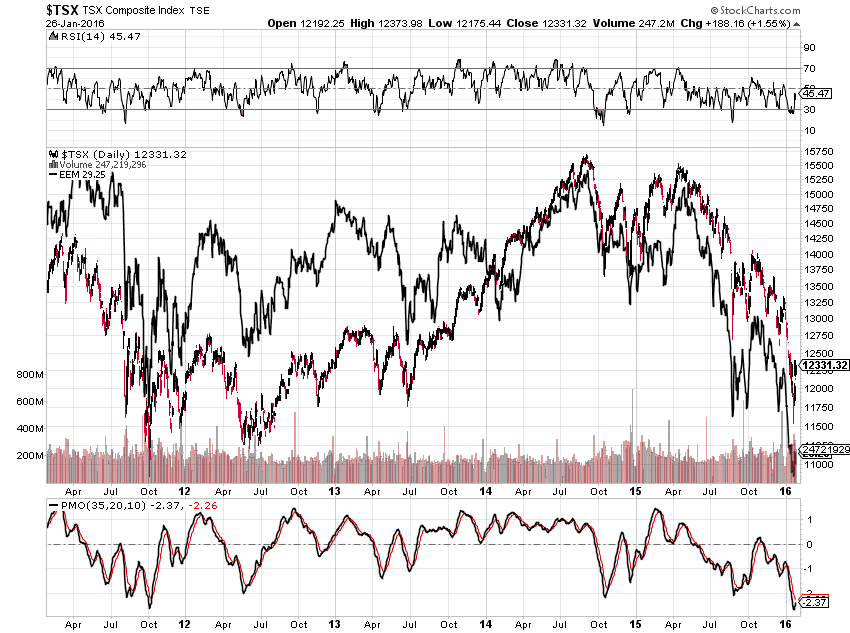
Since then, you can see from the 5-Year comparison chart below of Canada’s TSX and EEM (Emerging Markets ETF), that they have traded, essentially, lock-step.
Both are in bear markets since their highs in September 2014 — the TSX is -20.8% and EEM is -33.79%.
The next 3-Year comparison chart shows the big reason why…namely, the gyrating price (both to the upside and downside) of WTIC Crude Oil, which has had a major impact on Canada’s TSX. Oil is -71.45% since June 2014.
It would appear that, as goes the price of Oil, the TSX will continue to behave like an emerging market (unless Canada’s Federal government provides some kind of meaningful fiscal stimulus for alternative projects and, also, fast-tracks plans to improve its distribution methods to get its crude oil via pipelines from Alberta to the west and east for sale to world markets).
In the meantime, these are three charts to watch over the coming weeks and months for clues of either further weakness or evidence of bottoming and strengthening of the TSX, in particular, and, possibly, other world markets, as I mentioned in my post of January 5, 2015.


Leave A Comment