
The US Dollar (via the DXY Index) is pacing for its fourth consecutive day of losses today, the first time such a streak has transpired since the end of March. While the DXY Index was able to attempt a breakout of its two-month-long ascending triangle last week, it now appears that a false breakout scenario is on the table assuming a close below 95.53, the June 21 bearish daily key reversal and June 27 to 29 evening doji star candle cluster highs.
DXY Index Price Chart: Daily Timeframe (June 2017 to August 2018) (Chart 1)
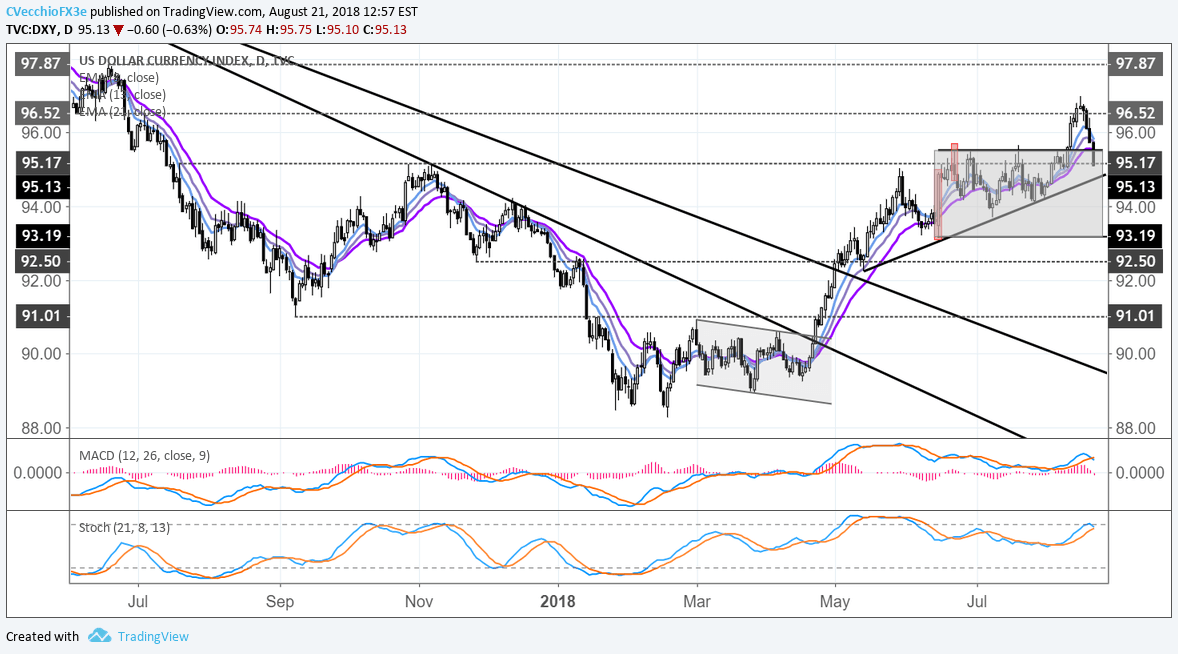
The doubt we cast last Thursday on the greenback’s ability to sustain a move higher, given how the drivers for the move were based in crisis events and not positive developments about the US economy (and thus, Fed policy), seems more appropriate just four days later. Out of necessity, the question has arisen, “is the US Dollar topping out?” There is some evidence to suggest that the bull case isn’t strong at the moment.
HOW MUCH MORE CAN MARKETS PRICE IN A SEPTEMBER FED RATE HIKE?
There is a strong case to be made that the US Dollar’s gains earlier this year, notably between March and June, were largely driven by the market’s changing perception of the Federal Reserve’s rate hike cycle. Even though the Fed, via its Summary of Economic Projections, had been outlining the path for three to four rate hikes in 2018, rates markets were only pricing in two hikes total this year back in March.
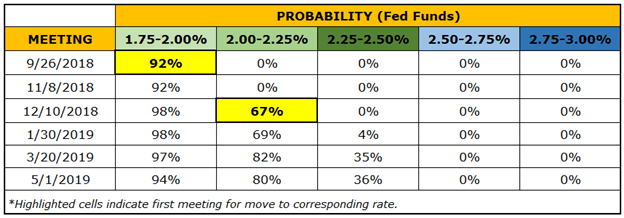
Fast forward to today, and two hikes have been realized, and two more are due in the coming months. But two more hikes through the end of the year have been priced in since the Fed’s June meeting: a week after the June meeting, markets were pricing in a 90% chance of a 25-bps hike in September; today, they’re pricing a 92% chance.
Federal Reserve Rate Hike Expectations (August 21, 2018) (Table 1)


Leave A Comment