
by Wim Grommen
The Dow Jones Industrial Average (DJI) Index is the only stock market index that covers both the second and the third industrial revolution. Calculating share indexes such as the Dow Jones Industrial Average and showing this index in a historical graph is a useful way to show which phase the industrial revolution is in. Changes in the DJI shares basket, changes in the formula and stock splits during the take-off phase and acceleration phase of industrial revolutions are perfect transition-indicators. The similarities of these indicators during the last two revolutions are fascinating, but also a reason for concern. In fact the graph of the DJI is a classic example of fictional truth, a fata morgana.

Transitions
Every production phase, civilization or other human invention goes through a so called transformation process. Transitions are social transformation processes that cover at least one generation. In this article I will use one such transition to demonstrate the position of our present civilization and its possible effect on stock exchange rates.
A transition has the following characteristics:
A transition process is not fixed from the start because during the transition processes will adapt to the new situation. A transition is not dogmatic.
Four transition phases
In general transitions can be seen to go through the S curve and we can distinguish four phases (see fig. 1):
A product life cycle also goes through an S curve. In that case there is a fifth phase:
5. the degeneration phase in which cost rises because of over capacity and the producer will finally withdraw from the market.
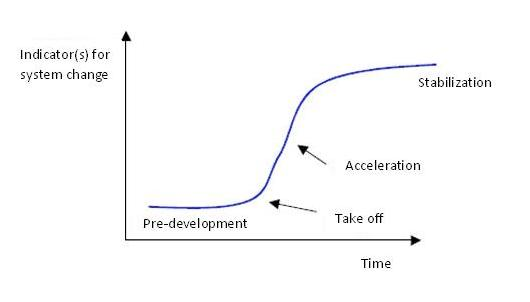
Figure 1. The S curve of a transition
Four phases in a transition best visualized by means of an S curve:
Pre-development, Take-off, Acceleration, Stabilization.
When we look back into the past we see three transitions, also called industrial revolutions, taking place with far-reaching effect :
Dow Jones Industrial Average (DJI)
The Dow Jones Industrial Average (DJI) index is the oldest shares index in the United States. A select group of journalists of The Wall Street Journal decide which companies are included in the most influential stock exchange index in the world. Unlike most other indices the Dow is a price average index. This means that shares with a high price have a great influence on the movements of the index. Calculating stock index values such as the Dow and presenting the index in a historical graphs is a perfect way of indicating which phase an industrial revolution is in.
The Dow was first published in 1896. The index was calculated by dividing the sum of the shares by 12:
Dow-index_1896 = (x1 + x2+ ……….+x12) / 12
An index is calculated on the basis of a set of shares. Every index has its own formula and the formula results in the number of points of the index. However, this set of shares changes regularly. It is therefore very strange that different sets of shares are represented by the same unit. After a period of 25 years the value of the original set of 12 apples is compared to the value of a set of 30 pears. In 1929 only 2 of the original 12 companies of the Dow were still present.


Leave A Comment