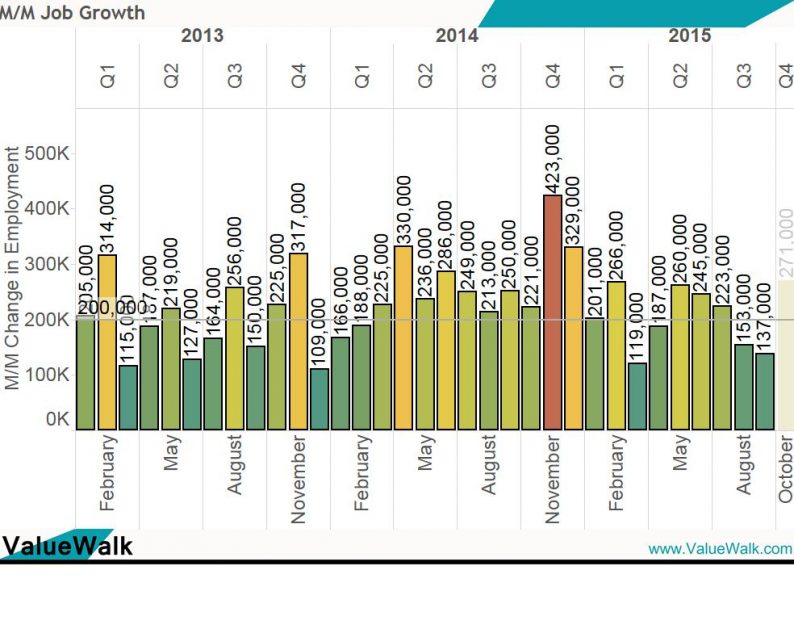
Friday’s employment report came in at +271K, more than 100K above the 160K the market expected. The +271K jump broke a 4-month deceleration in the U.S. jobs picture. The M/M jobs picture is often discussed by the top-line figure.This month it’s worth thinking about the full-time/part-time detail.
Amazingly, full-time employment growth came in at an incredible +540K.The prior month saw full-time job growth of +584K.Both figures are indicative of the American economy peaking, but that’s a discussion for another day.
Over the same two months, part time employment has declined by 447K and 269K respectively.

The strength in the American employment picture poses the question – How does the U.S. employment picture stack up internationally? Here’s a look.

Labor Market
The International Jobs Picture
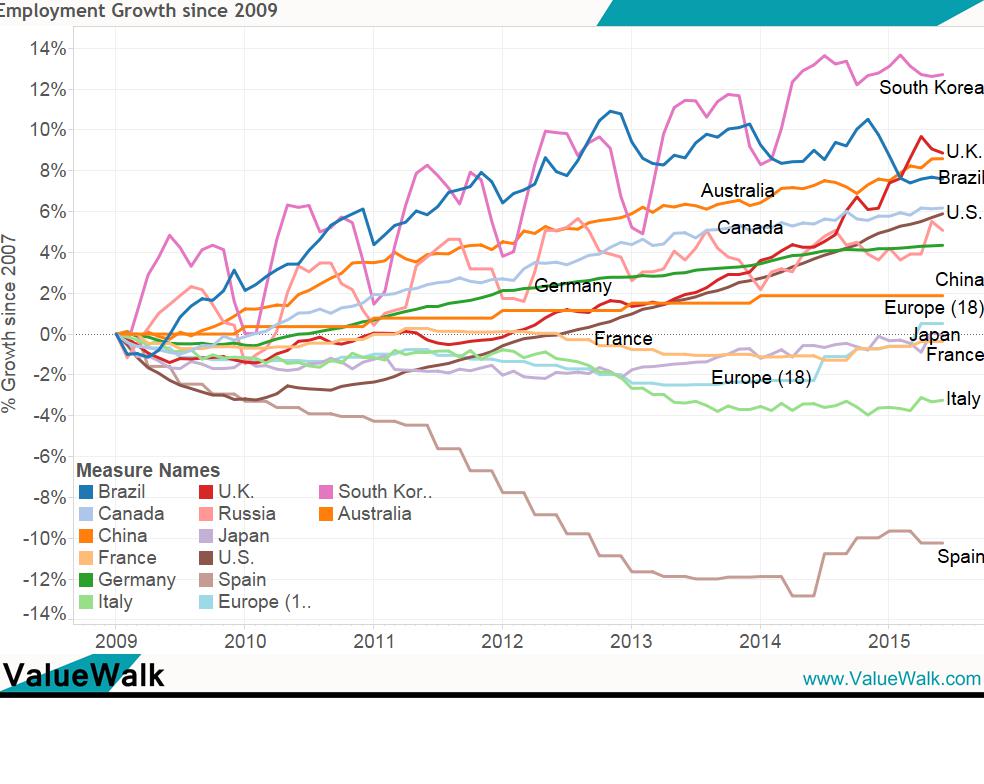
The following graphic looks at employment growth in most of the largest economies in the world, comprising the United States, the Euro Area, China, Japan, Germany, the United Kingdom, France, Brazil, Italy, Russia, Canada, Australia, South Korea, and Spain.India is left out because of a lack of timely data releases.
The first figure is a look at job growth by country since 2009.
Before looking, which country would you guess is on top? Which country is would you guess is on bottom?
Fascinatingly, the fastest growing businesses (at least in employment terms) are located in South Korea. Since 2009, employment in the east Asian country is up 13%.Well behind in second and third places are the United Kingdom and Australia. Both are at 9%.
The remaining top 5 areas are Brazil and Canada, up 8% and 6% respectively.
The bottom end comprises Spain (down 10%), Italy (down 3%), France and Japan virtually flat, and the European 18 (up a little less than a percent).
Labor Market
Why are the Figures So Disparate?
There’s a wide variation between business expansion and contraction across the globe. What explains the difference?


Leave A Comment