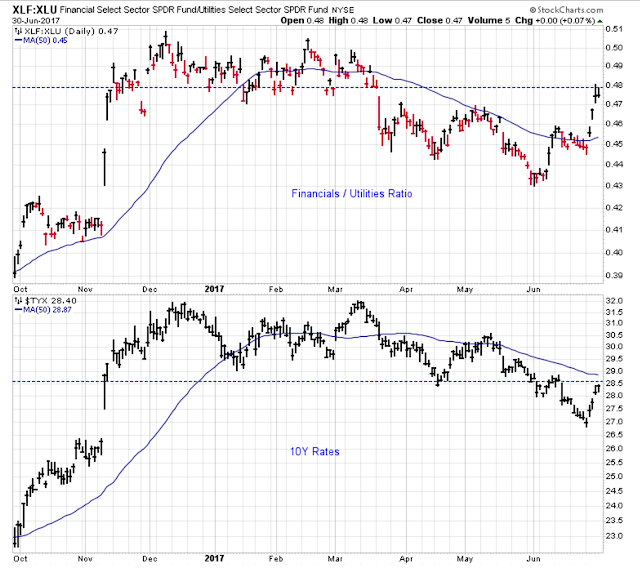
It seems like we are experiencing quite a bit of sector rotation. Last week all the talk was about Biotech. This week all the talk was about Financials. What will it be this coming week?
Before conceding that rates are headed meaningfully higher, the 10Y rate needs to be above its 50-day. Based on this chart below, I wouldn’t be surprised to see rates begin to head lower again along with the Financials.

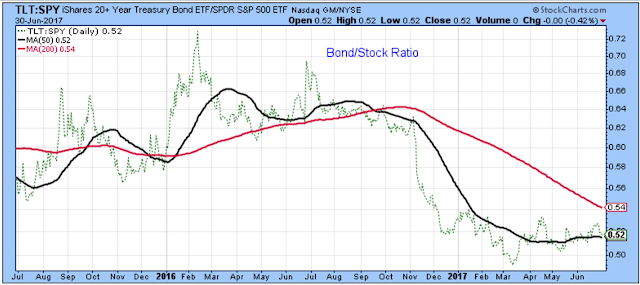
The Long-Term Outlook
Since we are on the subject of rates, it might be a good time to look at the bond/stock ratio. The ratio has bottomed out, but it has a way to go before it favors bonds over stocks. This chart says to stick with stocks for now.
Below is a very simple look at the long-term trend for stocks. I think that as long as this ETF is above this trend, you have to assume higher prices ahead.
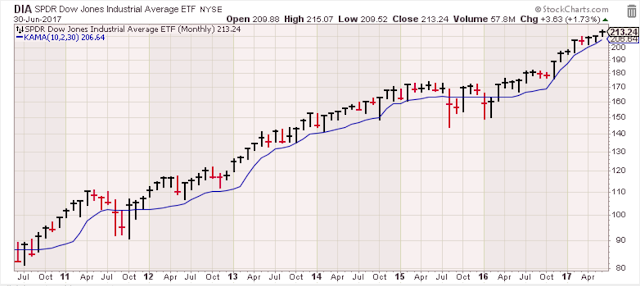
Here is a look at the very long-term trend. Again, at this time, you have to assume higher prices ahead.

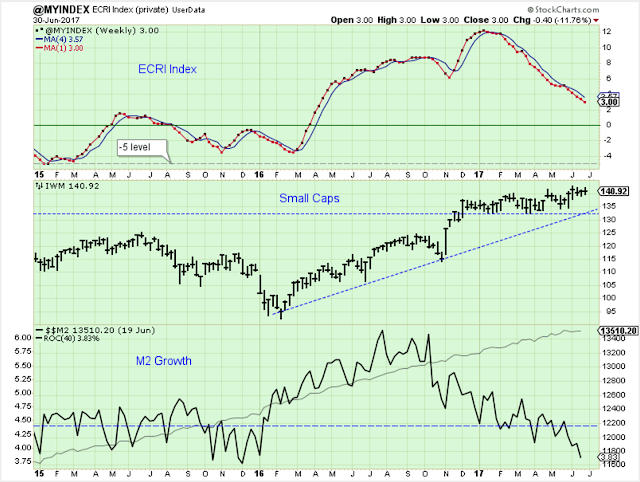
This is my usual Saturday morning chart, but I changed the M2 ROC from 12 to 40.
This chart is a concern. Yes, the small caps are holding above support, but the ECRI trend is pointing decisively lower. This indicator needs to level off soon.
M2 growth has been weak for awhile, but now it is near the low level established in 2015. I think we can expect a bounce in this growth rate, but this is not a helpful trend for stock prices.
The Medium-Term Trend
This is my favorite chart of the medium-term trend. At the moment, it is indicating that the medium-term is (or will be) under pressure. A meaningful decline in prices probably will not occur, though, unless this indicator dips below zero.

I think the medium-term trend has flipped to down (or a sideways consolidation). This chart shows why based on momentum. But, I should add a bit of caution because not every major indeex is showing this same weakness. For instance, the NYSE hasn’t rolled over yet.

Summary
The long-term outlook is positive.
The medium-term trend is down.
The short-term trend is down.


Leave A Comment