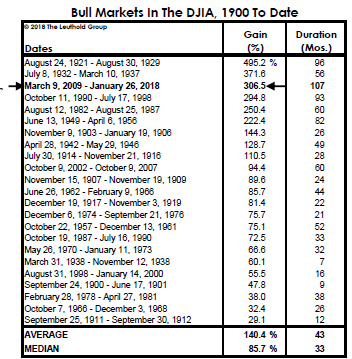
Tomorrow the S&P 500 will celebrate 3452 days or 115 months since its bear market low of 676 on March 9, 2009–officially now the longest expansion since 1900. This table from Leuthold Group summarizes all the expansion cycles since 1900 up to January 26, 2018. Since then, of course, the US stock market expansion has continued a further 7 months to reach tomorrow’s 115-month record.

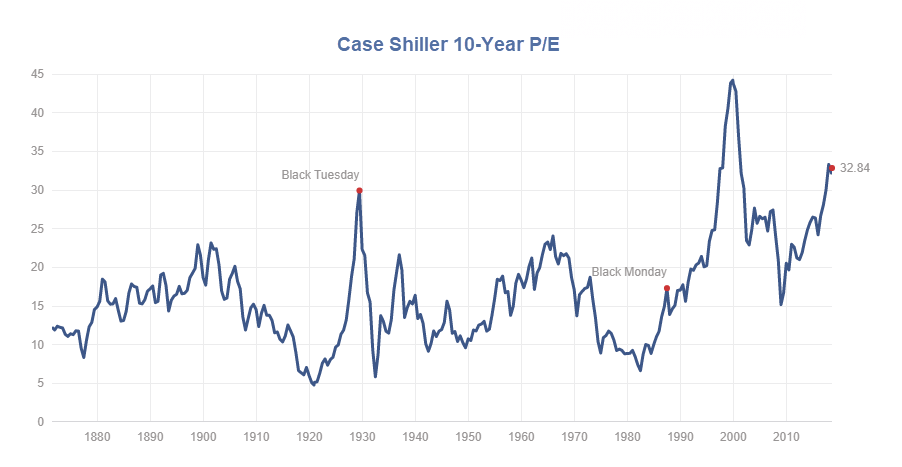
Pundits are arguing about whether or not market corrections of less than 20% in 2011 and 2016 should be rounded up to count as breaks in this remarkable run (more here). But in reality, secular bull and bear periods turn not on price but on valuation. And on the basis of valuation, the recent expansion is one for the ages, as shown below in this chart of the Case Shiller 10-year smoothed price to earnings ratio for US stocks since 1870. Today’s 32.84 reading remains in rare and infamous company–above the 1929 peak and below the all-time tech-mania top of 2000.
While extended Fed largesse, setting aside mark-to-market accounting, cost-cutting, under-investment in long-term assets and share buybacks have all enabled S&P 500 earnings (net income per share) to surge 300% since 2009, total revenue growth for the same companies was just 30% over the same time frame. Hence, on a price to sales basis, S&P 500 stocks are now trading at a manic 2.2x revenue and even higher than in 2000.
These eye-popping multiples, along with a dividend yield under 2%, all suggest that equity markets are nearing the end of the second cyclical expansion within the secular bear that began from peak valuations in 2000, and are next due for the third cyclical mean reversion within that secular bear. See more here in Ed Easterling’s work at Crestmont Research.com as well as his chart on left showing the Dow price cycles to the end of June and beginning in 2000.


Leave A Comment