
Markets are rather quiet in recent weeks. Is that a new trend or the calm before the storm?
As the month of April comes to an end, the month-to-date returns on key assets are almost neutral. Against April 1st, the S&P 500 is up 1.2 percent (from 2350 to 2380 points), gold is up 1.3 percent (from 1250 to 1269 points), crude oil is down 2.3 percent (from 51 to 49.19 points), the U.S. dollar is down 1.4 percent (from 100.30 to 98.90 points) and 10-year Yields are down 2.3 percent (from 23.4 to 22.8 points).
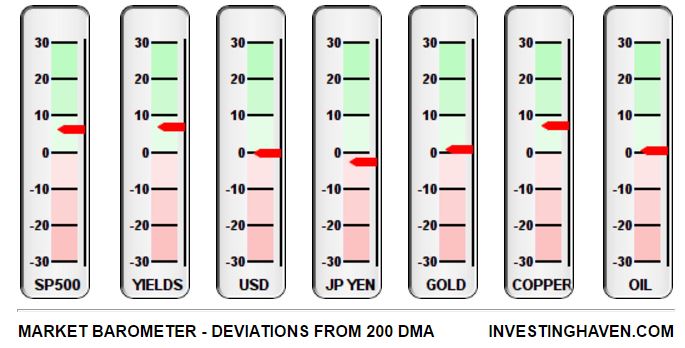
The neutral view in markets is confirmed by InvestingHaven’s market barometer, a view on markets that is created by its research team.
The market barometer looks at leading assets: how they trade compared their longer term trend (moving average), against each other, gives a unique perspective on ongoing trends.
Right now, most key assets are neutral. the U.S. dollar, gold and the Yen, as fear assets or safe haven assets, are trading almost exactly on their longer term trend.
The S&P 500 and Yields are slightly positive. Given stock markets trading at all-time highs, and some 7 percent above their long term trend, the question is how much upside potential is left.
In order to answer that last question, we look at 20-year Yields. That is a leading indicator for stock markets, as well as several risk assets. Its long term chart suggests that it is very close to a major peak within its decade long trend (pattern). It can peak between 3.0 and 3.1 points, which is 15 percent above today’s level. Note that 3.0 in 20-year Yields points to ‘minimum fear’. There are two scenarios going forward.
Either Yields will reverse their 4-decade long pattern, leading to disruption in stock and bond markets. That would be huge news, and the price level to watch is 3.1 points in 20-year Yields.
Either Yields go lower after touching 3.0 points, which would indicate that markets go in risk-off mode. Stocks would suffer, safe haven assets would become bullish.


Leave A Comment