
The weekly continuation chart of WTI Crude Oil displays an 18-month H&S top pattern. This is a chance that the Sep 28 high will represent the high of the right shoulder.
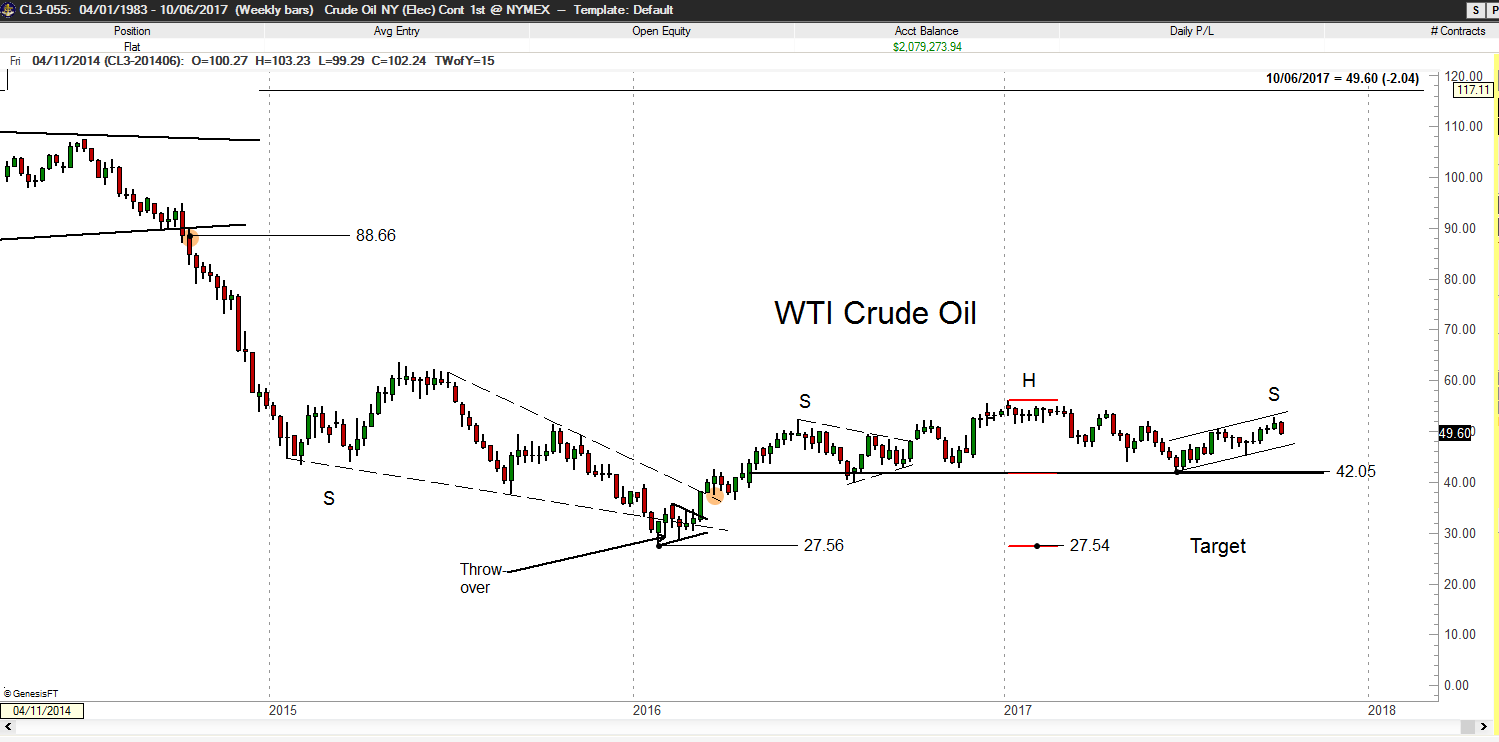
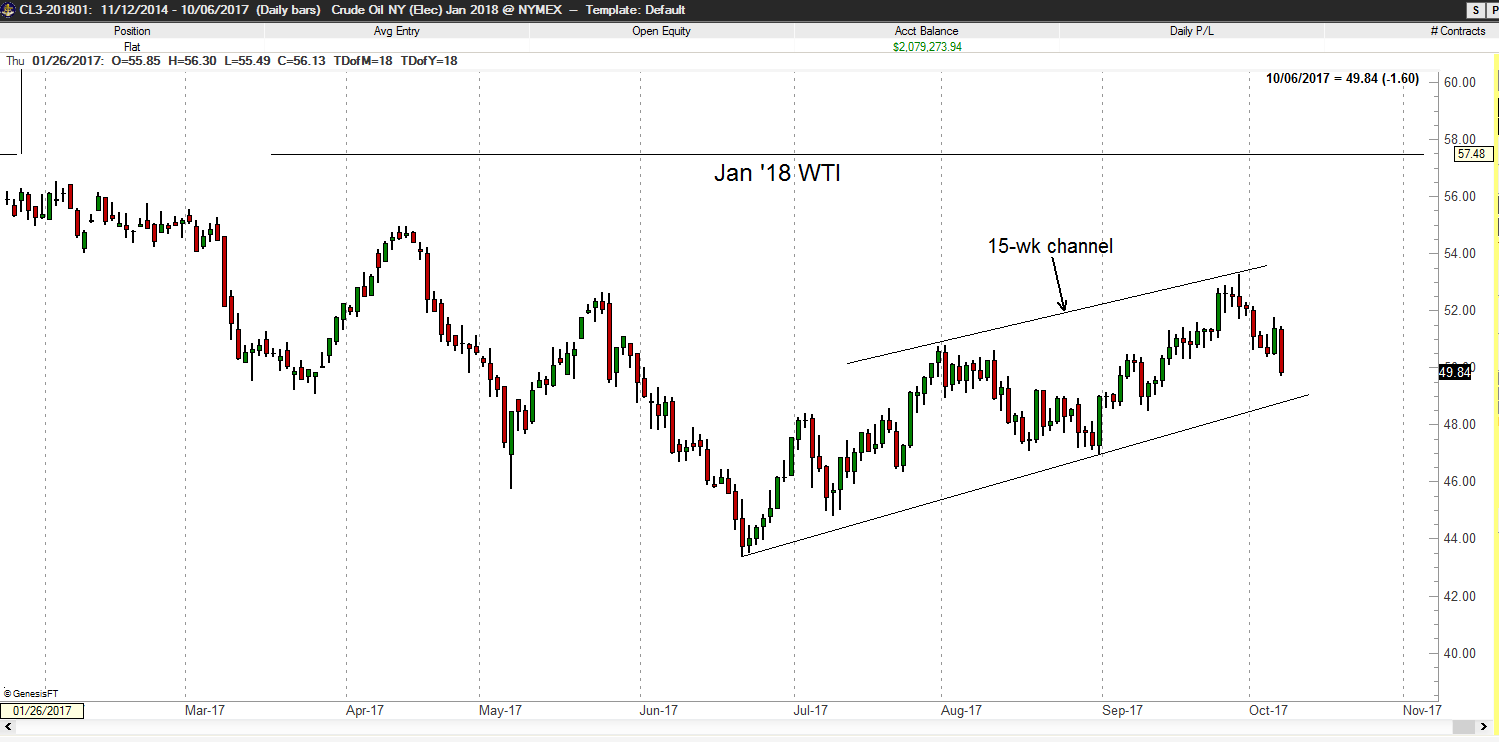
If this analysis is correct (always a big IF), the right shoulder appears to be taking the form of a 15-week channel.
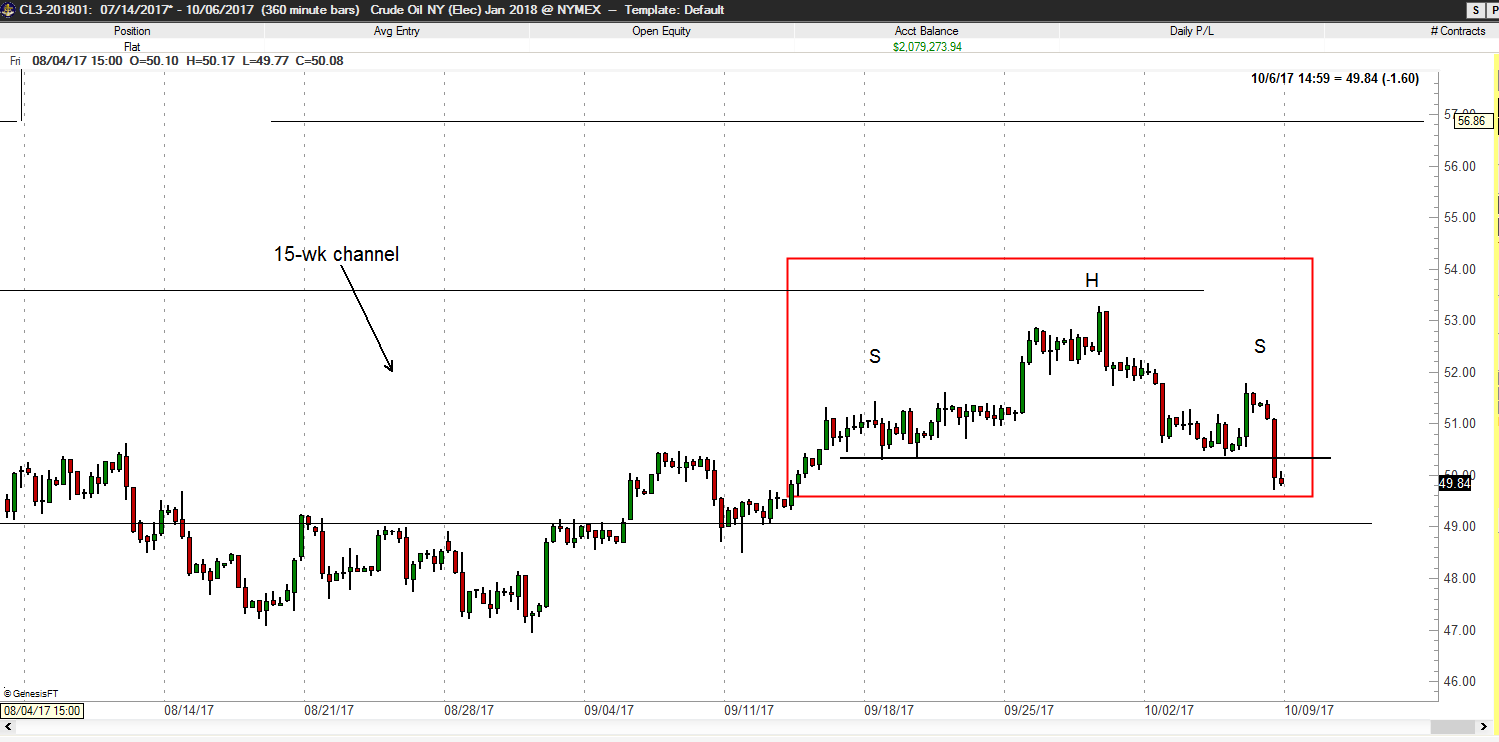
Note on the intraday graph (6-hour bars) a possible completed H&S top (red box). Always keep in mind that the reliability of chart construction is greatly diminished as shorter time frames are considered. The vast overwhelming proportion of intraday (and even daily) chart patterns morph into a different form. Nevertheless, given my overall view of Crude Oil I am willing to short the market if this intraday H&S is retested this coming week.
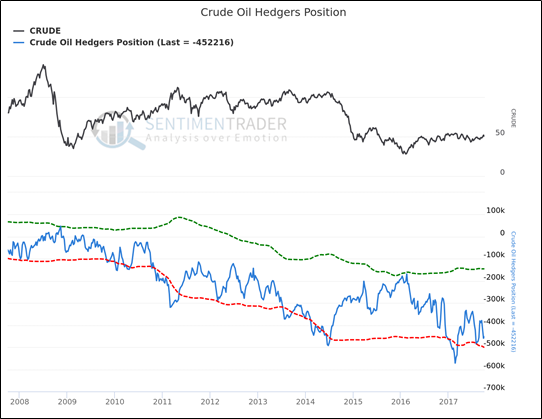
Commercial interests hold a near record short position in Crude Oil, exceeded only by the COT profile at the Jan/Feb 2017 and Jul 2014 highs.
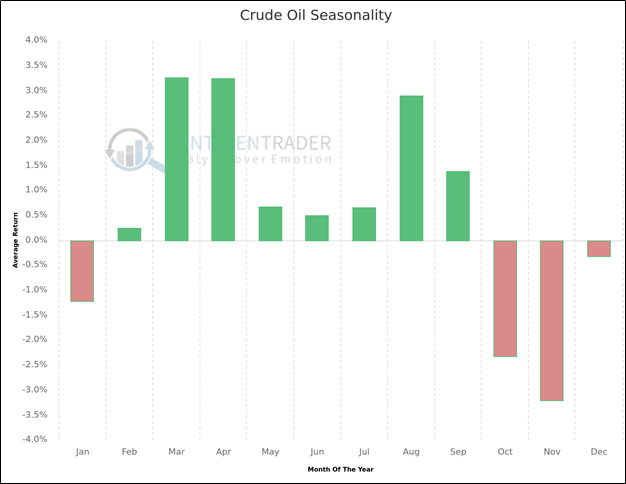
Crude Oil prices are entering a period of seasonal weakness that should extend through Jan 2018, as shown below.


Leave A Comment