In the fourth and final week of April, the biggest market moving news of the week wasn’t the election outcome in France, nor was it the release of President Trump’s highly anticipated tax plan (if you can call a one-page document a plan), nor was it anything to do with the kind of geopolitical events that have contributed noise to the markets over the last several weeks.
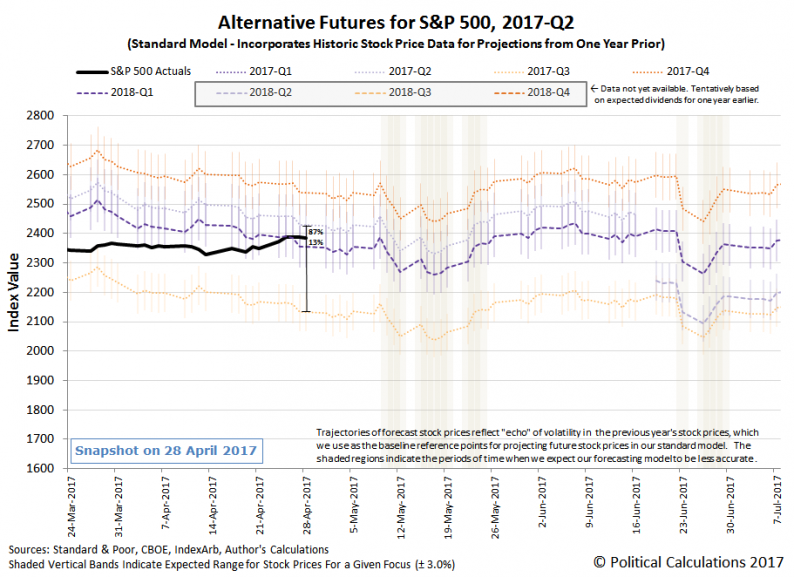
Instead, it was a combination of good old fashioned solid earnings reports and mostly positive economics news that defined the week that was for the S&P 500. As it should be, although as we’ll soon discuss, that good news comes with consequences. Here’s our alternative futures chart showing the actual trajectory of the S&P 500 with respect to what our dividend futures-based model projects for four different scenarios, each distinguished only by the expectations associated with the particular future point of time to which investors would need to fully focus their forward-looking attention to set today’s stock prices.

The consequences that comes with the week’s mostly positive market and economics news is that the Fed will be more likely to next hike its Federal Funds Rate, the basic interest rate that often sets the floor for all others in the U.S., sometime during 2017-Q2. Going by our estimate of the regular dividends per share that will be paid out during the quarter, we would estimate that investors are now assigning an 87% probability that will happen before the end of 2017-Q2, and only a 13% probability that the Fed will hold off until 2017-Q3.
Given where the S&P 500 started the week, we think that stock prices rose during the week in response to that stronger focus on 2017-Q2.
Before we get into the major news headlines that we flagged during Week 4 of April, we do want to emphasize that our analysis in assessing how far forward investors are focusing their attention is based on our estimate of the regular dividends per share for 2017-Q2. The raw data for that quarter is showing what we believe is an reporting anomaly, where the unadjusted version of our alternative futures chart looks like the one below….


Leave A Comment