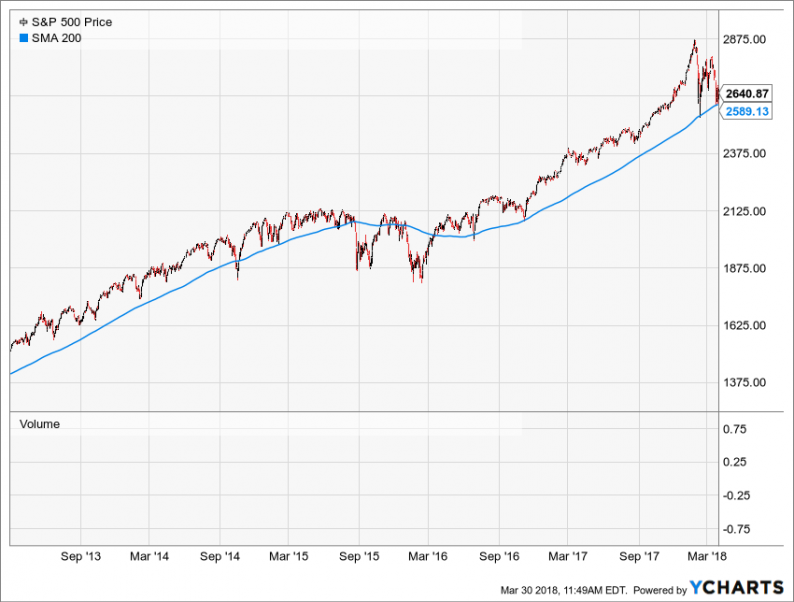
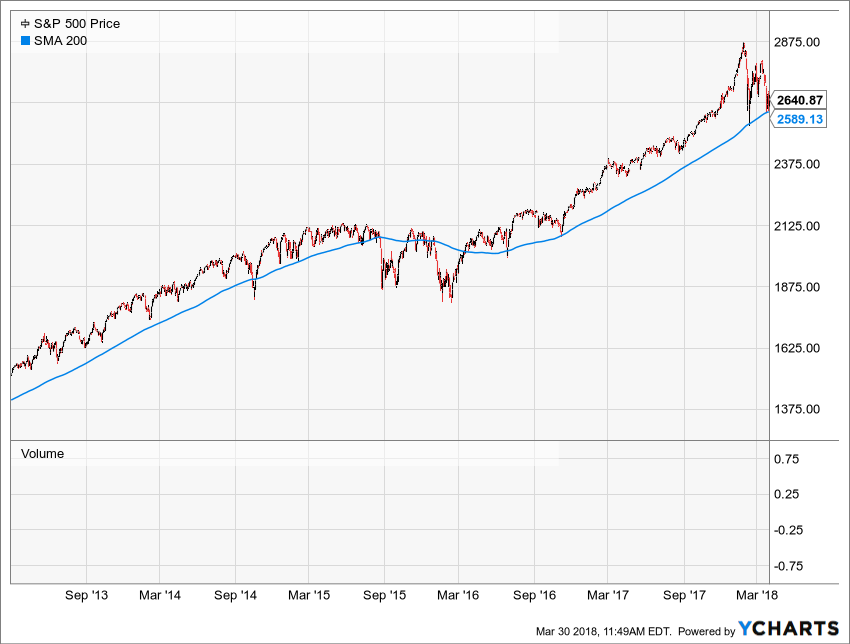
For the last five years the S&P 500 has been dancing up its ascending 200-day moving average (200-DMA), bouncing higher repeatedly whenever the dip-buyers did their thing. Only twice did the index actually break below this seeming Maginot Line: In August 2015, after the China stock crash, and in February 2016, when the shale patch/energy sector hit the wall.
As is evident below, since the frenzied peak of 2873 on January 26, the index has fallen hard twice—on February 8 (2581) and March 23 (2588). Self-evidently, both times the momo traders and robo-machines came roaring back with a stick-save which was smack upon the 200-DMA.
But here’s the thing. The blue line below ain’t no Maginot Line; it’s just the place where the Pavlovian dogs of Bubble Finance have “marked” the charts. And something is starting to smell.
In fact, it’s starting to smell very much like an earlier go-round when Pavlov’s 200-DMA barkers had enjoyed a prolonged ascent—-only to find an unexpected cliff-diving opportunity at the end.
We refer to the nearly identical five year run-up to the March 2000 top at 1508 on the S&P 500. Back then, too, the 200-DMA looked invincible, and had only been penetrated by the August 1998 Russian bankruptcy and the Long Term Capital Management meltdown a month later.
Indeed, the bounce from the October 8, 1998 interim bottom of 960 was nearly parabolic, rising by 57% to the March 2000 top.
That latter point might sound vaguely familiar. That’s because the rebound from the February 11, 2016 interim bottom (1829) to the January 26th top (2873) this year was, well, 57%!
Of course, we don’t cotton to numbers magic, but we do have some decent regard for history, logic and the politico-economic facts of life. And on that score, it would appear to us that what transpired last time may be a walk in the park compared to what present circumstances may bring.
As it happened, the S&P ground lower for a few months in the spring and summer of 2000 while the dotcom/NASDAQ 100 stocks were being immolated, but then cut loose decisively from the 200-DMA in early October.
Alas, five months thereafter the S&P 500 index was down 20% from its peak, and then tumbled deep into bear market territory from there.


Leave A Comment