The U.S. stock market has, for the most part, behaved in a very orderly fashion since the first quarter of 2016 ended just over a year ago.
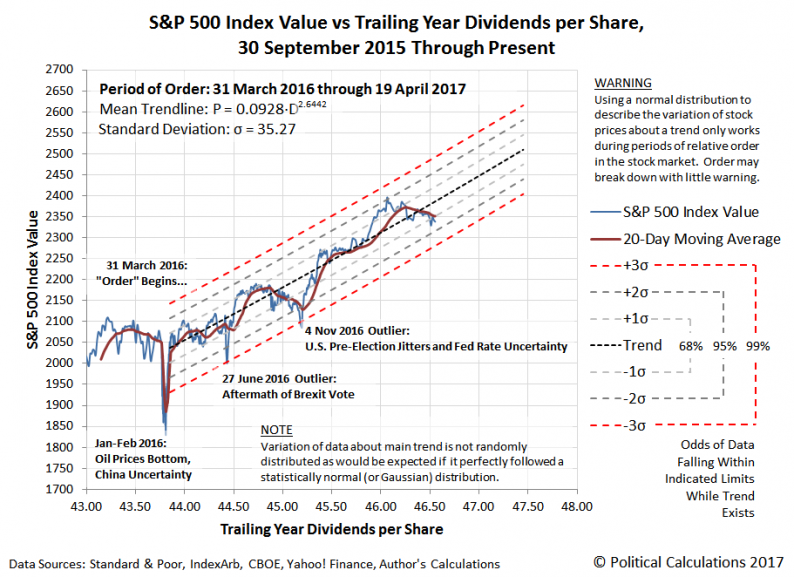
But since 1 March 2017, when the S&P 500 reached its all-time record peak closing value of 2,395.96, the S&P 500 has dropped diagonally by three standard deviations from that peak value with respect to its fundamental trendline, as determined from the relationship between its value and the S&P 500’s trailing year dividends per share.

To be fair, some would call that reverting to the mean, but since the S&P 500 peaked on 1 March 2017, the news that influences investors expectations for the future has been characterized by two main themes:
With all these things going on, a good question to ask might be how much more would it take for the S&P 500’s nearly 13-month old period of order to finally break down?
As you can see in the chart, the answer is something of a moving target, but if it were to happen today (20 April 2017), it would take a decline of 56 points, or 2.4%, from its 19 April 2017 closing value of 2,338.17.
That also assumes that order in stock prices can be described by something that looks like a normal distribution with respect to the mean trend line of the relationship between stock prices and their underlying trailing year dividends per share, which is not strictly true, but does make for occasionally useful observations.


Leave A Comment