
This latest real estate bubble looks just like the last one. It’s surged about the same, this time peaking a little higher, and has run for about as long. But what’s driving this bubble is totally different than what drove the last one.
The first bubble was thanks to Baby Boomers flooding the market as they surged through their peak home-buying years in unprecedented numbers. They were helped along with the most liberal lending standards in history. Remember the days of subprime, variable rates, and NINJA loans?
It was quite simply a case of excess demand outstripping even strong, rising supply. Both drove prices to extremes that few can afford. Eventually, defaults on those insane loans overwhelmed the market, sending the whole house of cards tumbling.
This time around, the situation is the opposite…
Supply (rather than demand) is driving this bubble. Baby Boomers have long since passed their peak home-buying cycle and Millennials don’t have the job and income growth the Boomers had. Besides, they’re more gun-shy after witnessing the largest real estate losses in more than a century, when housing collapsed between 2006 and 2012. Oh, and they’re facing tighter lending standards and the burden of student loans.
You would never suspect we are in a bubble looking at this chart.
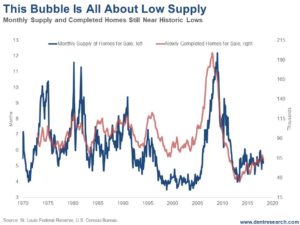
Back in 2008, both new-home completions and months-supply-in-inventory were at all-time highs, and demand still outstripped supply.
Builders were solidly behind that bubble, but on a lag, even after sales peaked in late 2005 and prices started to fall after early 2006.
New homes completed peaked at 199,000 a month in June 2008. Inventory peaked at just over 14-month’s supply just before that.
When the bubble finally burst, new homes fell to 35,000 in 2013 and inventory fell to just under four months’ worth. That was an 82.4% fall in home completions and a 73% fall in months’ supply – the highest on record.


Leave A Comment