
Further to last Wednesday’s post, here’s where the U.S. Major Indices stood after each close on Thursday and Friday, respectively.
Thursday’s Close:
Wednesday’s sell-off continued on Thursday, with the nine Major Indices closing at or near a lower near-term support level (or below, as was the case with the NDX and COMPQ), as shown on the following daily charts.

The following percentages gained/lost graph shows the amounts that these indices had lost to date from their highs of this year.
The Russell 2000 and Nasdaq Transportation Indices were now in correction territory, while the Nasdaq Composite, Nasdaq 100 and Dow Transports Indices were close to that 10% threshold.

Price on the SPX:VIX ratio had fallen to just above a level that I’ve long referred to as the Uncommitted Zone (between 100 and 60), as shown on the daily ratio chart below.
A drop and hold below 100 would ensure further weakness ahead in the SPX, while a drop and hold below 60 could produce a catastrophic drop in equities.
Either way, as long as price on this ratio remains below 150, we’ll see wild, large intraday swings in both directions on the SPX.
This volatility and weakness will likely not die down until price breaks and holds above 200.

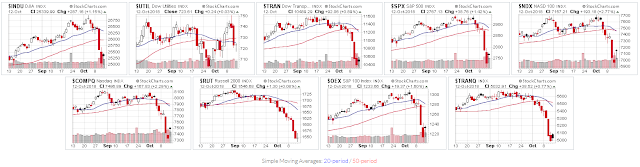
Friday’s Close:
The week’s sell-off stalled on Friday, as we witnessed wild, large intraday swings in both directions before prices settled, either a bit higher, or slightly unchanged (Russell 2000, Utilities, and Nasdaq Transportation Indices), as shown on the following 2-month daily charts of the nine Major Indices.
The following graph shows the percentages that these indices have gained/lost Year-to-date.


Leave A Comment