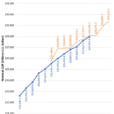
New Fed Q4 Z.1 Credit and flow data was out this week. For the first time since 2007, annual Total Non-Financial Debt (NFD) growth exceeded $2.0 TN – a bogey I’ve used as a rough estimate of sufficient new Credit to fuel self-reinforcing reflation. Based on some nebulous “neutral rate,” the Fed rationalizes that it’s not behind the curve. Robust “money” and Credit growth argues otherwise. A Bloomberg headline from earlier in the week: “Taylor Rule Suggests Fed is About 12 Hikes Behind.”
Though not so boisterous of late, there’s been recurring talk of “deleveraging” – “beautiful” and otherwise – since the crisis. Let’s update some numbers: Total Non-Financial Debt (NFD) ended 2008 at $35.065 TN, or a then record 238% of GDP. NFD ended 2016 at a record $47.307 TN, an unprecedented 255% of GDP. In the eight years since the crisis, NFD has increased $12.243 TN, or 35%. Including Financial Sector (that excludes the Fed) and Foreign U.S. borrowings, Total U.S. Debt has increased $11.422 TN to a record $66.079 TN, or 356% of GDP. It’s worth adding that the $2.337 TN post-crisis contraction in Financial Sector borrowings was more than offset by the surge in Federal Reserve liabilities.
For 2016, NFD expanded $2.117 TN, up from 2015’s $1.929 TN – to the strongest growth since 2007’s record $2.501 TN. Household borrowings increased $521bn, up from 2015’s $384bn, to the strongest pace since 2007’s $947bn. Household mortgage borrowings jumped to $248bn, up from 2015’s $129bn. On the back of an unusually weak Q4, total Business borrowings declined to $724bn last year from 2015’s $812bn (strongest since ‘07’s $1.117 TN).
The Bubble in Federal obligations runs unabated. Federal debt jumped $843bn in 2016, up from 2015’s $725bn increase to the strongest growth since 2013’s $857bn. It’s worth noting that after ending 2007 at $6.074 TN, outstanding Treasury debt has inflated more than 160% to $16.0 TN. As a percentage of GDP, Treasury debt increased from 42% to end 2007 to 86% to close out last year.
Yet Treasury is not Washington’s only aggressive creditor. GSE Securities jumped a notable $352bn in 2016 to a record $8.521 TN, the largest annual increase since 2008. In quite a resurgence, GSE Securities increased almost $1.0 TN over the past four years. Treasury and GSE Securities (federal finance) combined to increase $1.194 TN in 2016 to $24.504 TN, or 132% of GDP. For comparison, at the end of 2007 Treasury and Agency Securities combined for $13.449 TN, or 93% of GDP.
The unprecedented amount of system-wide debt is so enormous that the annual percentage gains no longer appear as alarming. Non-Financial Debt expanded 4.7% in 2016, up from 2015’s 4.4%. Total Household Debt expanded 3.6%, with Total Business borrowings up 5.6%. Financial Sector borrowings expanded 2.9% last year, the strongest expansion since 2008.


Leave A Comment