It’s worth turning for a bit to look at the housing market. Shelter is a large part of what consumers spend money on, and therefore a large part of the CPI. It also happens that primary rents (if you rent your dwelling) and “Owners’ Equivalent Rent” or OER tend to be some of the slowest-moving pieces of the CPI. I’ve said many times that if you can get the direction of OER right, it’s very hard to be extremely wrong on the direction of core inflation.
Recently, there’s been some softening in home sales, and so in some quarters there has been an alarm raised that OER is about to start softening and therefore core inflation has peaked. My purpose in this article is to examine that evidence with an eye that is a bit more studied on these matters.
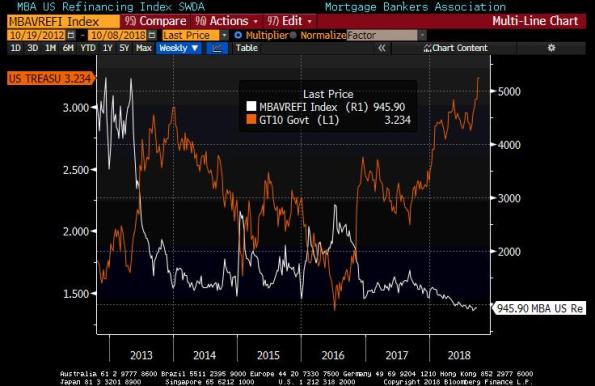
I think that often, economists tend to see patterns in the data when those patterns are congruent with what their models suggest should be happening. For example, it is reasonable to think that high home prices, coupled with rising mortgage rates, ought to slow home sales. There’s certainly evidence that changes in yields affects refinancing activity, as the chart below (source: Bloomberg) relating the Mortgage Bankers’ Association refi index to 10-year yields shows. The recent rise in yields (I’ve shown Treasuries, but mortgage rates move similarly) has depressed refinancing activity – and this makes sense, since fewer mortgages are profitable to refinance at these rates.

Alas, this relationship doesn’t hold very well when it comes to purchase data. Far more important to a home purchaser are current incomes and job prospects, both of which remain relatively strong for now. This next chart shows 10 year yields against the MBA “Purchase” index. At best, interest rates are a secondary or tertiary effect. This makes sense because the decision to refinance a house is a financing decision; the decision to buy a house in the first place is an investing decision.


Leave A Comment