I last wrote about the 10YR T-Note, 10YR Rate, and the US Dollar (DX) here.
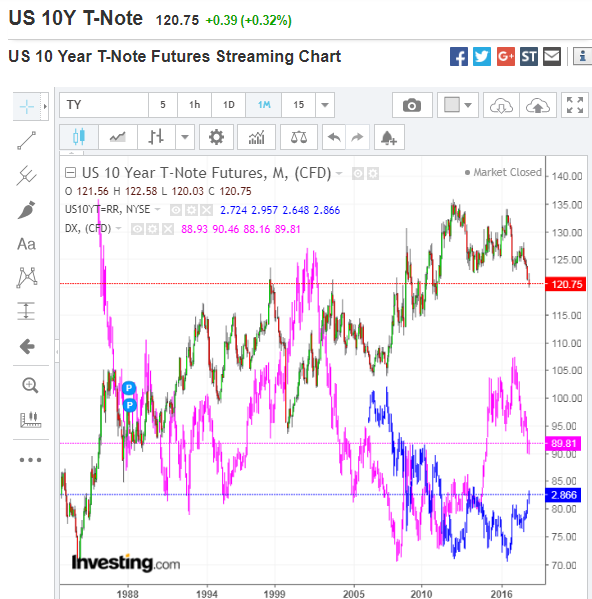
The following monthly comparison chart shows the price action of all three. The US Dollar, generally, trends in the same direction as the 10YR T-Note, but has seen much more volatile swings. The 10YR Rate has recently broken above a very long-term downtrend line and is threatening to break above 3%, a level last hit in January 2014.

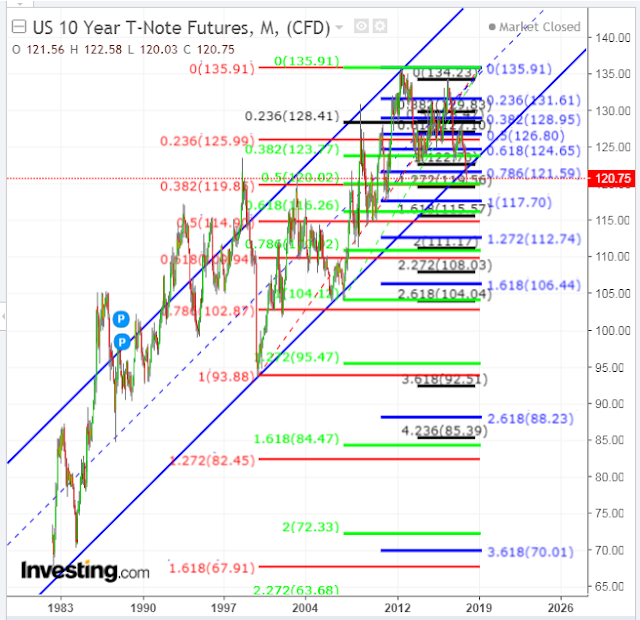
There are four sets of Fibonacci retracement drawings depicted on the following monthly chart of the 10YR T-Note, as well as a very long-term uptrending channel.
Price has recently broken below the bottom of this channel and sits at/near major support at the convergence of various levels of three of these Fib retracements (two long term and one short term) around 120.00. Major resistance lies a short distance above at 121.59 to 122.70 ( two short term Fib levels and channel confluence).
We’ll see if buyers step in to 10YR T-Notes and the US Dollar if the 10YR Rate spikes up to/through 3%.
Conversely, and as I mentioned in my above-referenced post, if DX fails to stabilize around 90.00, the next major support lies below around the 84.55 level. As well, the next major support level for the 10YR T-Note sits around 115.00 to 116.00 (confluence of three sets of Fib retracements levels…two long term and one short term).


Leave A Comment