The main economic news this week was the Fed’s release of the latest Beige Book. Let’s take a look at some important points, supplemented with last week’s retail sales and industrial production release.
Most Districts reported some growth in consumer spending through the holiday season, with the pace of growth typically characterized as ranging from slight to moderate, and as strong in Minneapolis. New York, Richmond, and Dallas noted that sales were sluggish or had softened. Unseasonably warm weather was blamed for damping overall sales in Cleveland, Richmond, and Dallas, and for weaker apparel sales in New York. Richmond and Chicago also noted disappointing clothing sales. Similarly, San Francisco reported that apparel sales at brick-and-mortar stores failed to meet expectations. Minneapolis noted record-breaking online sales, while Cleveland described greater optimism among retailers anticipating enhanced opportunities from e-commerce.
Auto sales have continued to be positive in most reporting Districts since the previous Beige Book, with strength reported in Richmond, Atlanta, and Chicago. However, Kansas City reported that sales dropped markedly compared with last year, and New York and St. Louis reported recent slowing in activity. Contacts in roughly half of the Districts cited continued lower gas prices as a contributing factor for auto sales, particularly for increases in SUV and light truck sales.
Seven districts reported some type of retail sales disappointment. Some stated the pace was sluggish, while some noted weakness was related to a particular item (such as clothes).Several others attributed the problems to weather.There are also potential signs that auto sales are topping. KC saw a “markedly” large Y/Y drop, while two other districts reported a slowdown.
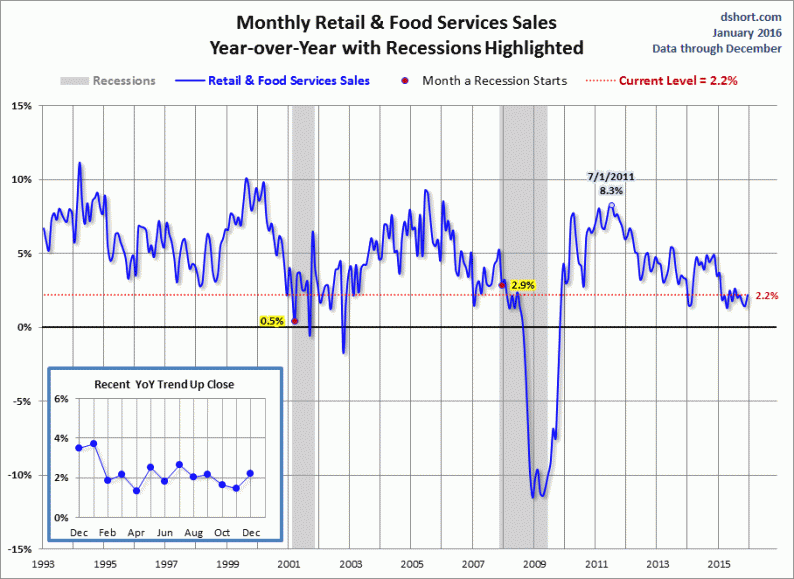
Friday’s weak retail sales figures confirmed the weakness. The headline number dropped .1% M/M. However, the Y/Y series is concerning. Consider the following two charts from Doug Short:
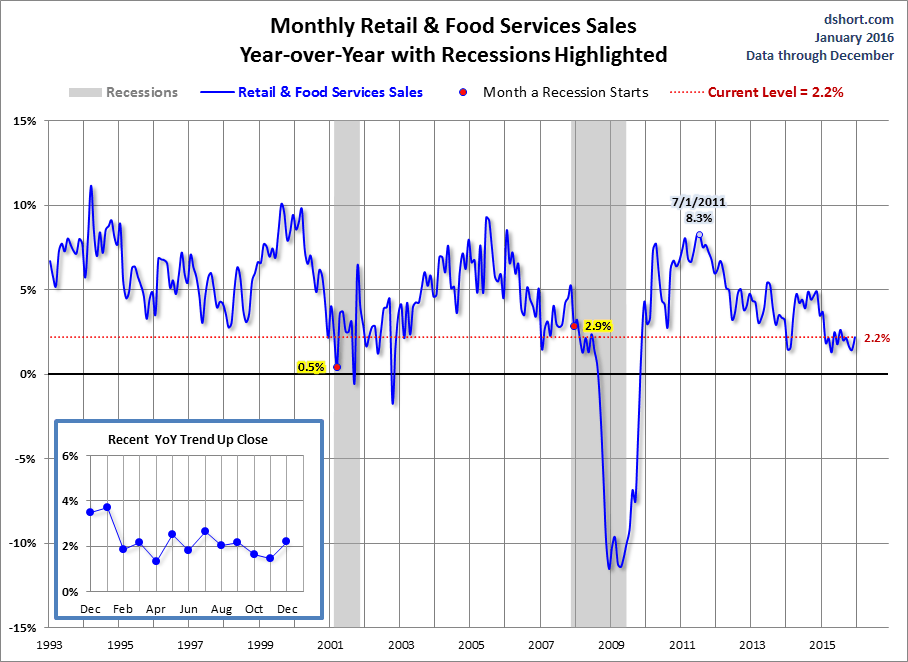

The top chart shows the Y/Y change in the headline number, while the bottom chart shows the “core” rate. Unfortunately, both lead to the same conclusion: current levels were last seen during a recession.
Next, let’s turn to manufacturing.






Leave A Comment