
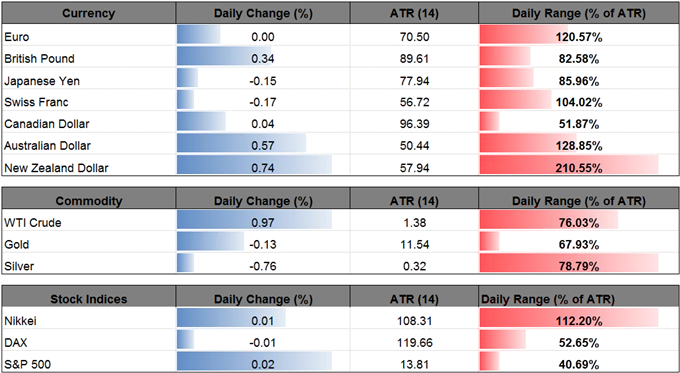
Ticker
Last
High
Low
Daily Change (pip)
Daily Range (pip)
NZD/USD
0.7319
0.7369
0.7247
55
122
NZD/USD breaks the monthly opening range following the semi-annual Humphrey-Hawkins testimony, but the near-term outlook remains riddled with mixed signs as the pair fails to test the 2017-high (0.7376).
The price action from February may serve as a blueprint as the rebound from the May-low (0.6818) appears to be exhausted, and the resilience in the kiwi-dollar exchange rate may largely unravel over the coming days as New Zealand’s Consumer Price Index (CPI) is expected to slow to an annualized 1.9% from 2.2% in the first-quarter of 2017. Signs of subdued inflation may spark a bearish reaction in NZD/USD as it encourages the Reserve Bank of New Zealand (RBNZ) to keep the official cash rate at the record-low, and Governor Graeme Wheeler may endorse a wait-and-see approach until he departs from the central bank in September as ‘numerous uncertainties remain and policy may need to adjust accordingly.’
NZD/USD Daily
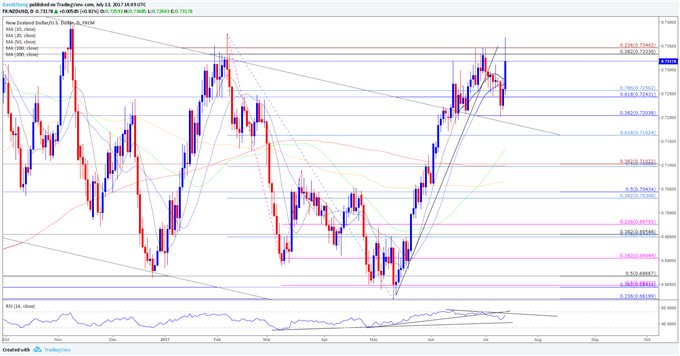
Chart – Created Using Trading View
Ticker
Last
High
Low
Daily Change (pip)
Daily Range (pip)
USD/CAD
1.2745
1.2771
1.2721
6
50


Leave A Comment