
Dollar/CAD had a massive turnaround, reaching new highs before turning sharply lower. Will it continue falling? GDP is the primary event in a light week leading into Easter. Here are the highlights and an updated technical analysis for USD/CAD.
Everything went in favor of the Canadian dollar: the US removed a key demand that blocked the NAFTA negotiations, the Federal Reserve made a dovish hike (no upgrade in the dot-plot), oil prices went higher and last but not least, inflation is on the rise in Canada. Together with the official exemptions from steel and aluminum tariffs from its southern neighbor, USD/CAD made a huge turn.
Updates:
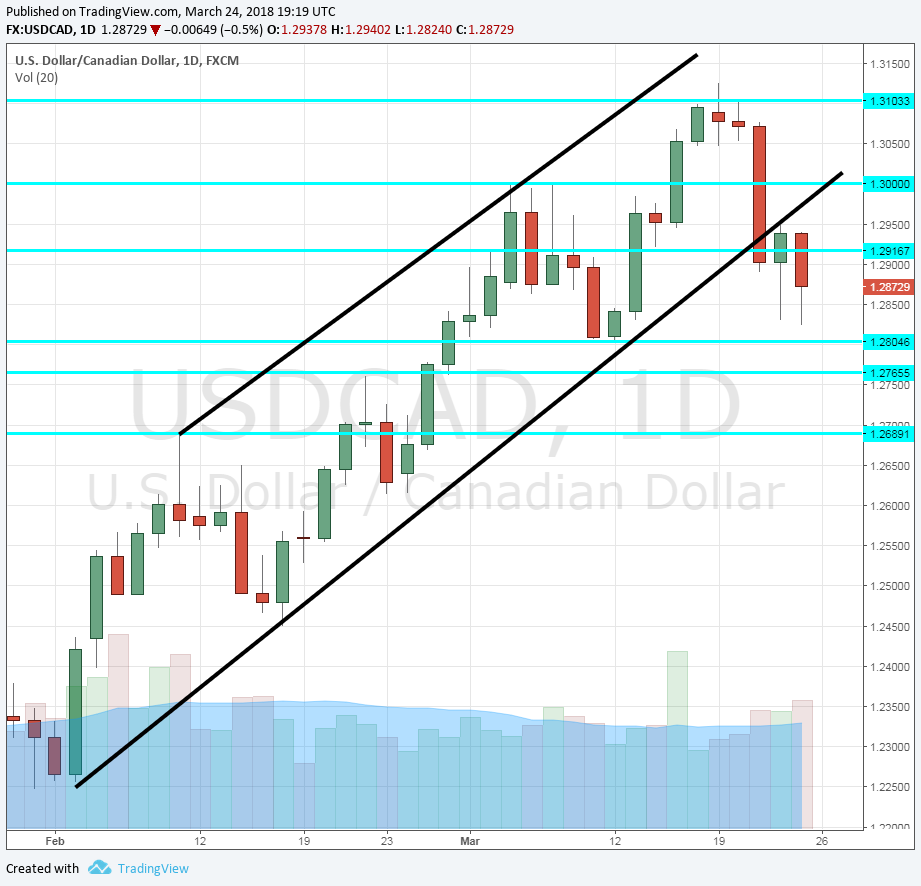
USD/CAD daily graph with support and resistance lines on it. Click to enlarge:
All times are GMT
USD/CAD Technical Analysis
Dollar/CAD initially broke above 1.31 (mentioned last week). but then turned south. On the way, it broke below the uptrend support line.
Technical lines from top to bottom:
1.3180 was a support line in 2017 and now turns into resistance. 1.31 is a round number and immediate resistance.
1.30 is a round number that is eyed by many. 1.2920 was a triple top in late 2017 and switches positions.
1.2790 was high in mid-November and serves as resistance. 1.2665 was a was a double-bottom in November and works as strong support.
It is followed by 1.26, a round number that worked as resistance in October. 1.2540 capped the pair in early October when it traded in a narrow range.
I am neutral on USD/CAD


Leave A Comment