
Between another batch of political turmoil and a less-than-confident undertow to begin with, stocks were brutalized this past week. Though it wasn’t the biggest weekly loss of the year, that’s not saying much – we’ve seen some unusually large setbacks this year.

The biggest fear at this point is that this will turn into something more, dishing out another dose of panic that inflicts more damage than we’ve suffered so far. The S&P 500 has put (and maintained) some serious pressure on its lower 20-day Bollinger band, and has broken back below most of its key moving average lines. There’s been quite a bit of volume behind the selling effort too.
We’ll detail it all with charts below, but first, let’s run down last week’s and preview this week’s economic data.
Economic Data
It was mostly buried by all the political rhetoric and the market meltdown, but we also got a small amount of economic news last week that merits a closer look.
First and foremost, though there’s no chart, the Federal Reserve did end up cranking the Fed Funds Rate higher, to the tune of a quarter of a percent. The target base rate now stands at 1.62%. More important, new Fed chair Jerome Powell is picking up where Yellen left off, maintain a modestly hawkish stance that actually bodes well for the economy. The fact that the announcement didn’t rattle or shock investors is a good thing.
The highlight of the week was home sales for February – new and existing. Existing home sales reached a pace of 5.54 million, topping expectations, while new home sales fell a little bit (and missed expectations) to an annual pace of 618,000. Still, the overall trend is encouraging.
New and Existing Home Sales Charts
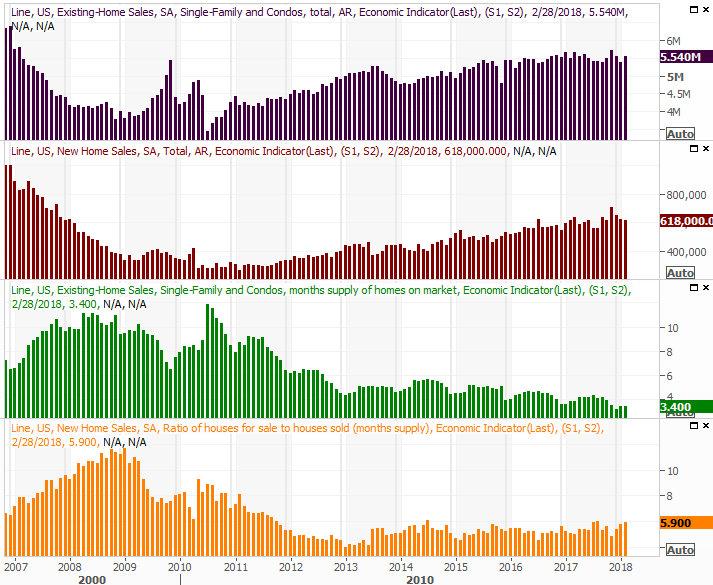
Source: Thomson Reuters Eikon
One noteworthy nuance in the data…sales of new homes are lagging, and it’s not really a lack-of-inventory problem. This suggests that while the construction market may not be red hot, the mortgage market is doing just fine despite rising interest rates.


Leave A Comment