
S&P500
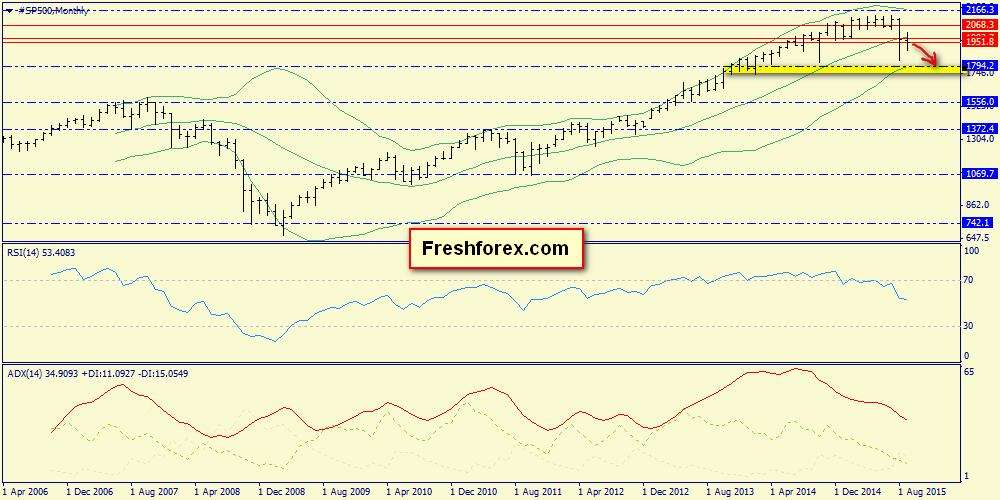
Monthly chart: a continued correction in the direction of the lower Bollinger band (1794.2). We can not exclude formation of the inside bar in September.
Click on picture to enlarge
Weekly chart: a classic false breakdown of IB also indicates readiness of the index to decline to 1794.2.
Click on picture to enlarge

The daily chart: intermediate support on the lower Bollinger band (1887.5) can delay decline, which fits into the scenario suggesting formation the IB on the monthly chart.
Click on picture to enlarge
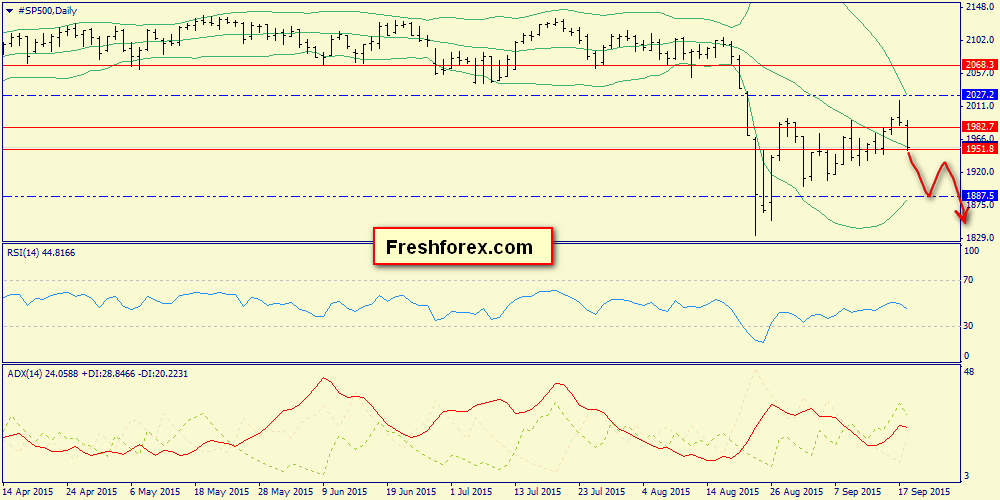
Expectations: decline to 1887.5 and upward bounce to 1951.0
Trade solutions:
1) Sales to 1887.5 and 1794.2 (in the middle run).
“Brent”
Monthly chart: suppression of bullish pinbar for August. The lower Bollinger band still looks at 34.90 with a confidence.
Click on picture to enlarge

Weekly chart:decline is complicated by weakness of bears (as evidenced by convergence of the oscillator). However, envelopes are expanding, bearish pinbar still has a potential.
Click on picture to enlarge
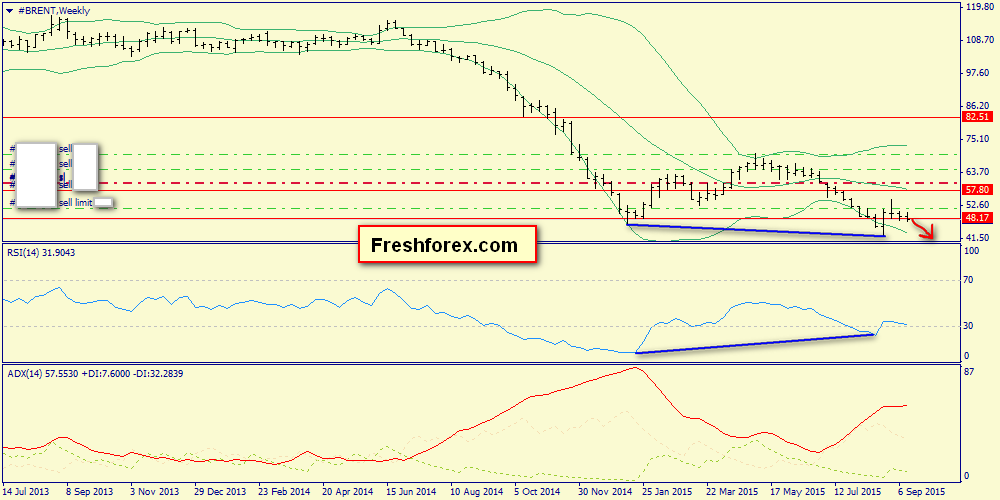
The daily chart: local support on horizontal lower Bollinger band 43.33
Click on picture to enlarge

Expectations: decline to 43.33
Trade solutions:
1) Keep Sell trades to 43.33.
Gold
Monthly chart: a continued formation of the inside bar. If that happens, we will have a good setup in October.
Click on picture to enlarge
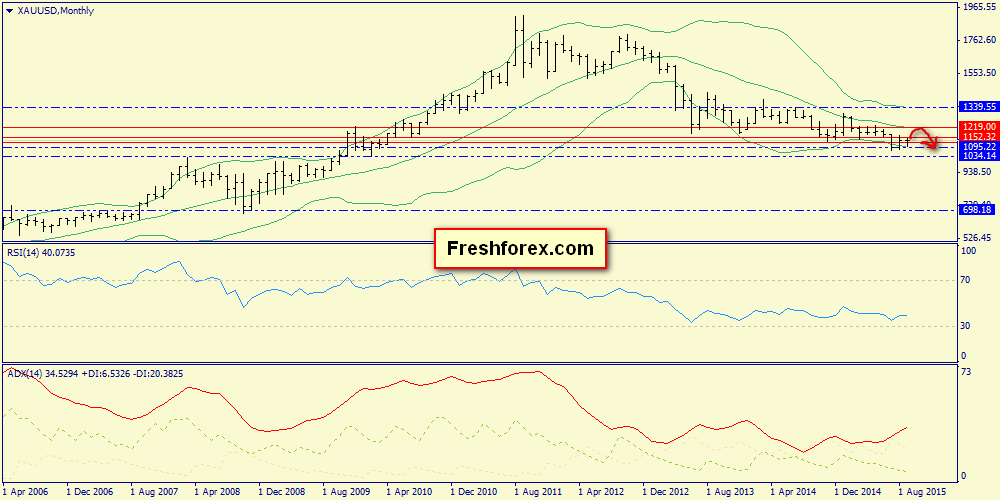
Weekly chart: flat and two resistance on the way – the middle Bollinger band (1152.32) and upper (1219.00).
Click on picture to enlarge

The daily chart: here we also have horizontally located envelopes, so the range of the week will be inside 1095.22-1152.32
Click on picture to enlarge

Expectations: flat in the range 1092.22-1152.32
Trade solutions:
1) We buy to 1152.32 and sell from 1152.32 to 1092.22


Leave A Comment