
SPX500 WEEKLY PRICE CHART
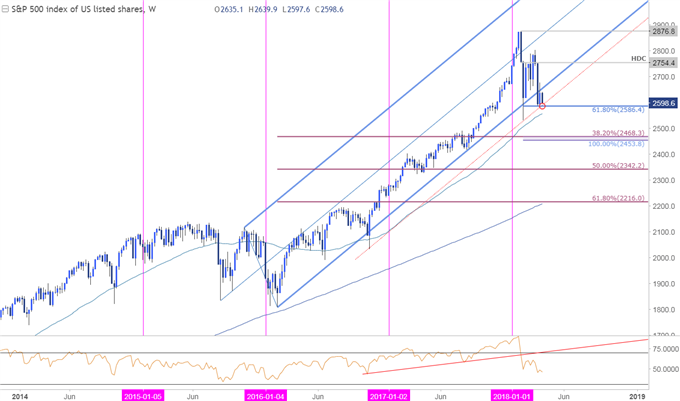
Notes: Simplicity is key- Last month we highlighted key support in the S&P 500 at the, “confluence of the 61.8% extension and the 200-day moving average around 2586/90.” A sliding parallel (red) of the dominant slope (blue) extending off the November 2016 lows also converges on this region and further highlights the technical significance of this support zone. Price is testing this threshold into the monthly open- look for a decisive reaction early in the month.
Bottom Line: A break/weekly close below this critical support confluence risks substantial losses for the index with such a scenario targeting the 52-week moving average around ~2550s backed by confluence Fibonacci support at 2453/68. Interim resistance stands with former pitchfork support ~2660 with a breach above the yearly high-day close at 2754 needed to alleviate further downside pressure (bearish invalidation).
AUD/USD WEEKLY PRICE CHART
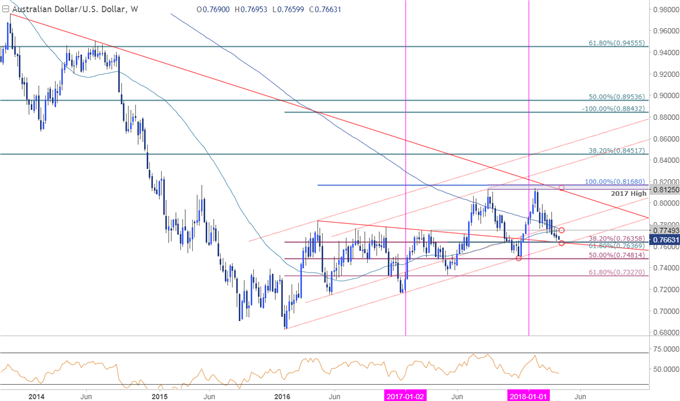
Notes: The Australian Dollar has approached a long-term support confluence we’ve been tracking since the start of the year at 7612/37. This region represents a critical inflection point for price and IF broken would risk a substantial sell-off in the Aussie. That said, we’re looking for signs of support this week with a breach above confluence resistance at 7750 needed to alleviate further downside pressure.
Bottom line: The immediate short-bias is at risk heading into 7612/37 and from a trading standpoint I’ll be looking for evidence of a near-term low in this range. A break lower would keep the focus on subsequent support targets at 7481 and the 61.8% retracement of the 2016 advance at 7327.
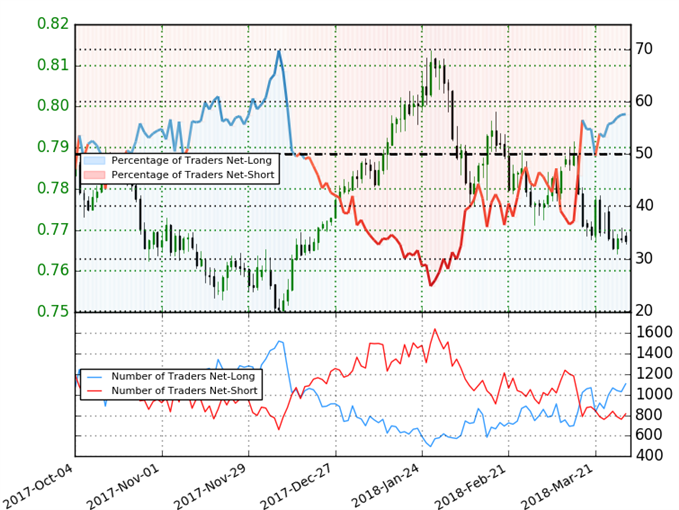
AUD/USD IG CLIENT SENTIMENT


Leave A Comment