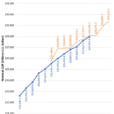
The Rent Café gave me their weighted national rental price data. Let’s compare to the CPI and Case-Shiller home prices.
Rent Café vs Owners’ Equivalent Rent vs Rent of Primary Residence
Data courtesy of the RENTCafé and the BLS Owners’ Equivalent (OER) via Fred the St Louis Fed repository.
The Owners’ Equivalent Rent (OER) Calculation method is absurd.
The expenditure weight in the CPI market basket for Owners’ equivalent rent of primary residence (OER) is based on the following question that the Consumer Expenditure Survey asks of consumers who own their primary residence:
“If someone were to rent your home today, how much do you think it would rent for monthly, unfurnished and without utilities?”
OER is the largest single component in the CPI. It makes up 24.28% of the index. The CPI category, rent of primary residence is 7.8% of the CPI.
January 2018 Year-Over-Year Comparison
OER Substitutes
The direct cost of purchasing a house is not in the CPI because the BLS considers housing as “capital goods”.
Tail Chasing Exercise
Whether or not one agrees with the BLS treatment, the Fed made a huge mistake ignoring escalating home prices in the housing bubble years.
And they are doing it again now. Another round of asset bubble deflation is coming up.
The Fed chases its tail in a perpetual cycle looking for inflation, not noticing the obvious, measurable price inflation in home prices and other assets.


Leave A Comment