
NZD/USD Daily
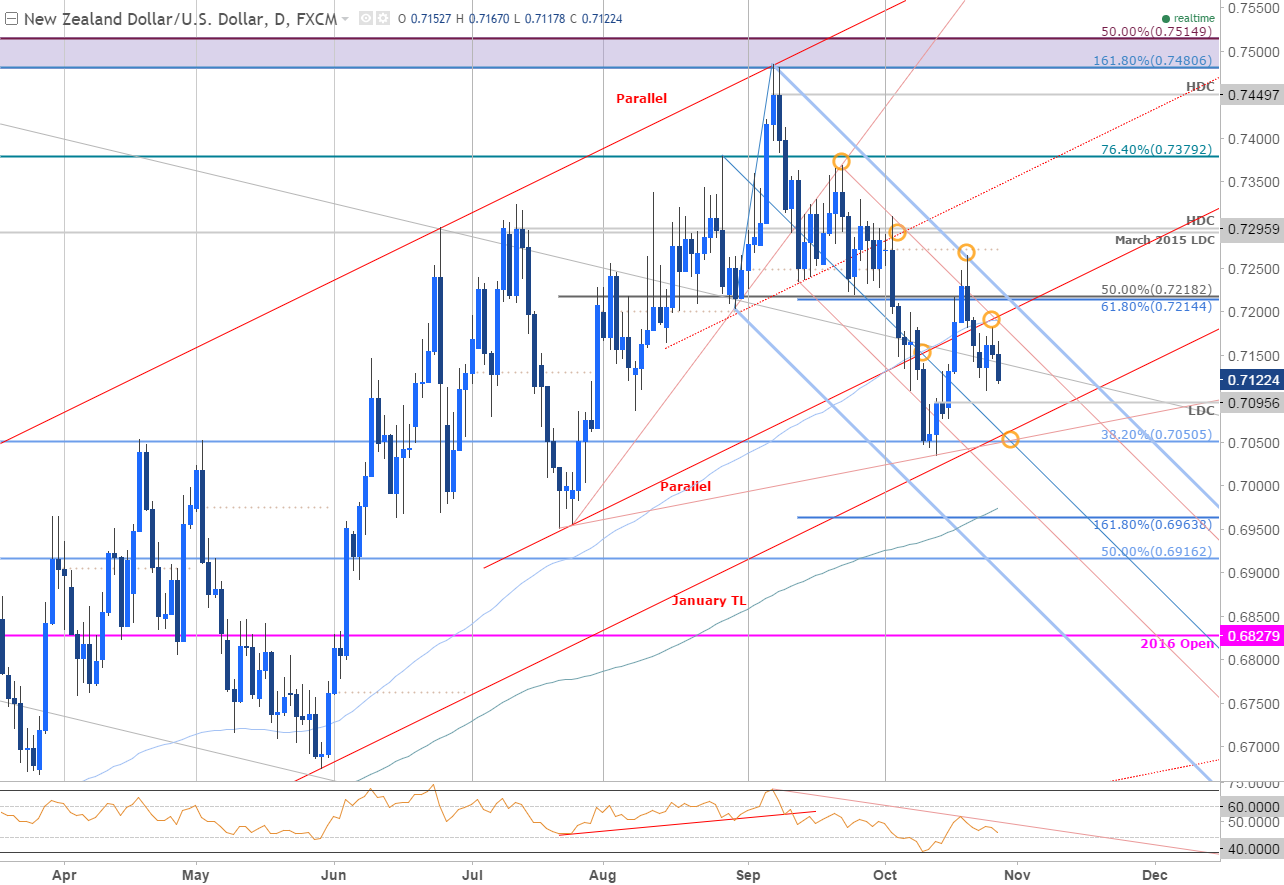
Chart Created Using TradingView
Technical Outlook: NZDUSD has been trading within the confines of a broad descending pitchfork formation extending off the yearly highs. We’ve continued to track this setup on SB Trade Desk with the weekly opening range in focus heading into tomorrow’s U.S. 3Q GDP release. The focus remains lower while sub-7214/18with subsequent targets at the monthly low-day close at 7095 & confluence support into 7050.
NZD/USD 240min
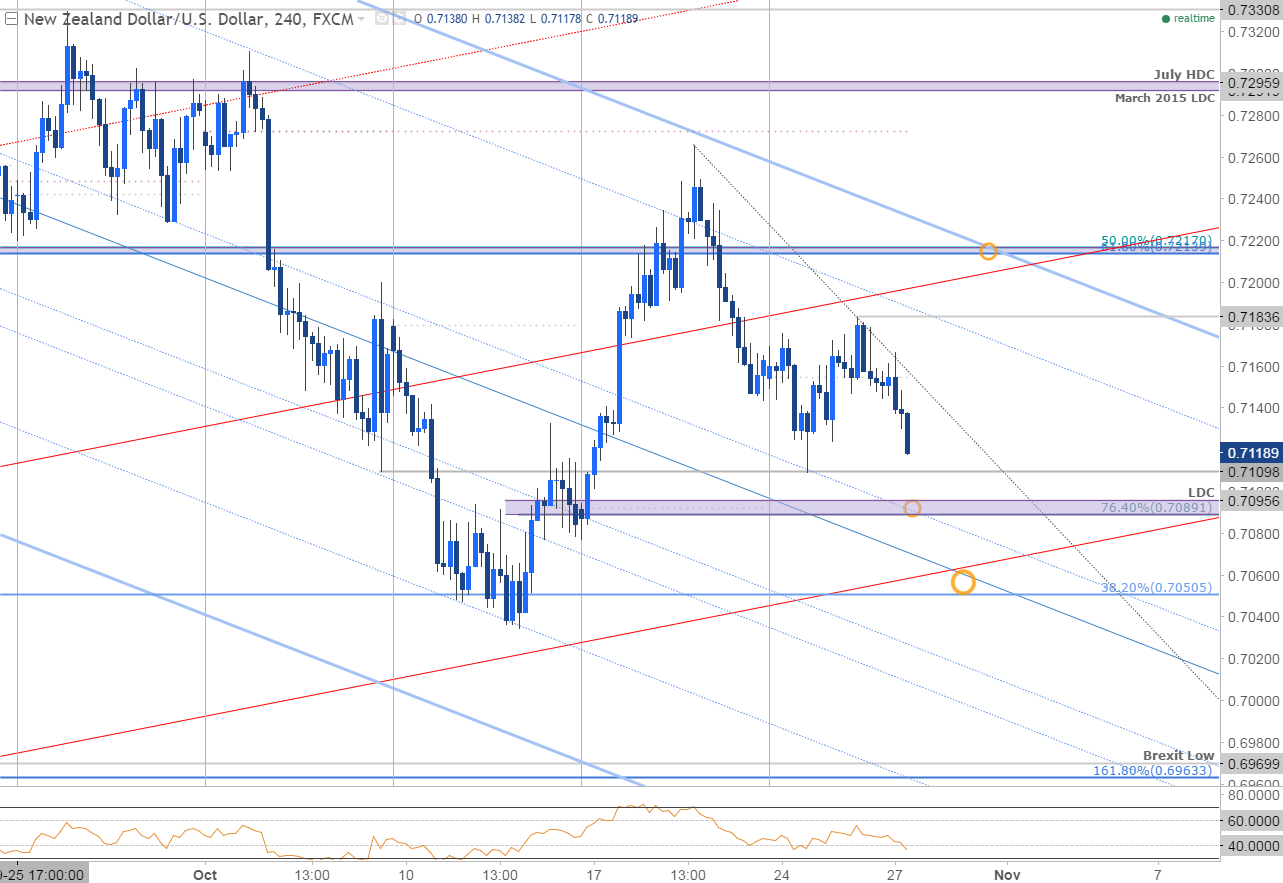
Notes: A closer look at intraday price action highlights a well-defined weekly opening range and we’ll be looking for a break to validate our near-term bearish outlook. A break below key confluence support at 7050would risk substantial losses for the kiwi with such a scenario targeting a sliding parallel around the 70-handle backed by more significant support at the 6963/70– a region defined by the confluence of the 161.8% extension, the Brexit swing low & parallel support extending off the monthly lows.
Interim resistance stands with a basic trendline extending off last week’s high backed by the weekly opening range high at 7184 & bearish invalidation at 7214/18. From a trading standpoint, I would be looking to fade strength while below the weekly high with a break lower targeting subsequent objectives into structural support.

Related Posts
 US Real M0 Money Supply Contracts By The Most In 68 Years
 Buying Insurance Stocks On Near Term Weakness
 This simple Bitcoin options strategy allows traders to go long with limited downside risk
- Brazilian federal deputy proposes crypto payment option for workers
 Central Bankers Put Ponzi And Madoff To Shame
 Charts Of The Day: US Dollar And Gold


Leave A Comment