Bitcoin (BTC) remains well above the crucial support at $25,250, indicating that market participants have shrugged off the news of the lawsuit by the United States Securities and Exchange Commission (SEC) against Binance and Coinbase. When markets do not stay lower for long after negative news, it is a sign that traders are looking to buy the dips rather than panic and dump their holdings.
ARK Invest CEO Cathie Wood has been buying the dip in crypto-related stocks since the SEC unleashed its recent crypto regulatory action. First Wood purchased $21 million worth of Coinbase stock on June 6 and followed that up with a purchase of Block Inc. shares worth $19.9 million between June 7 and 8.
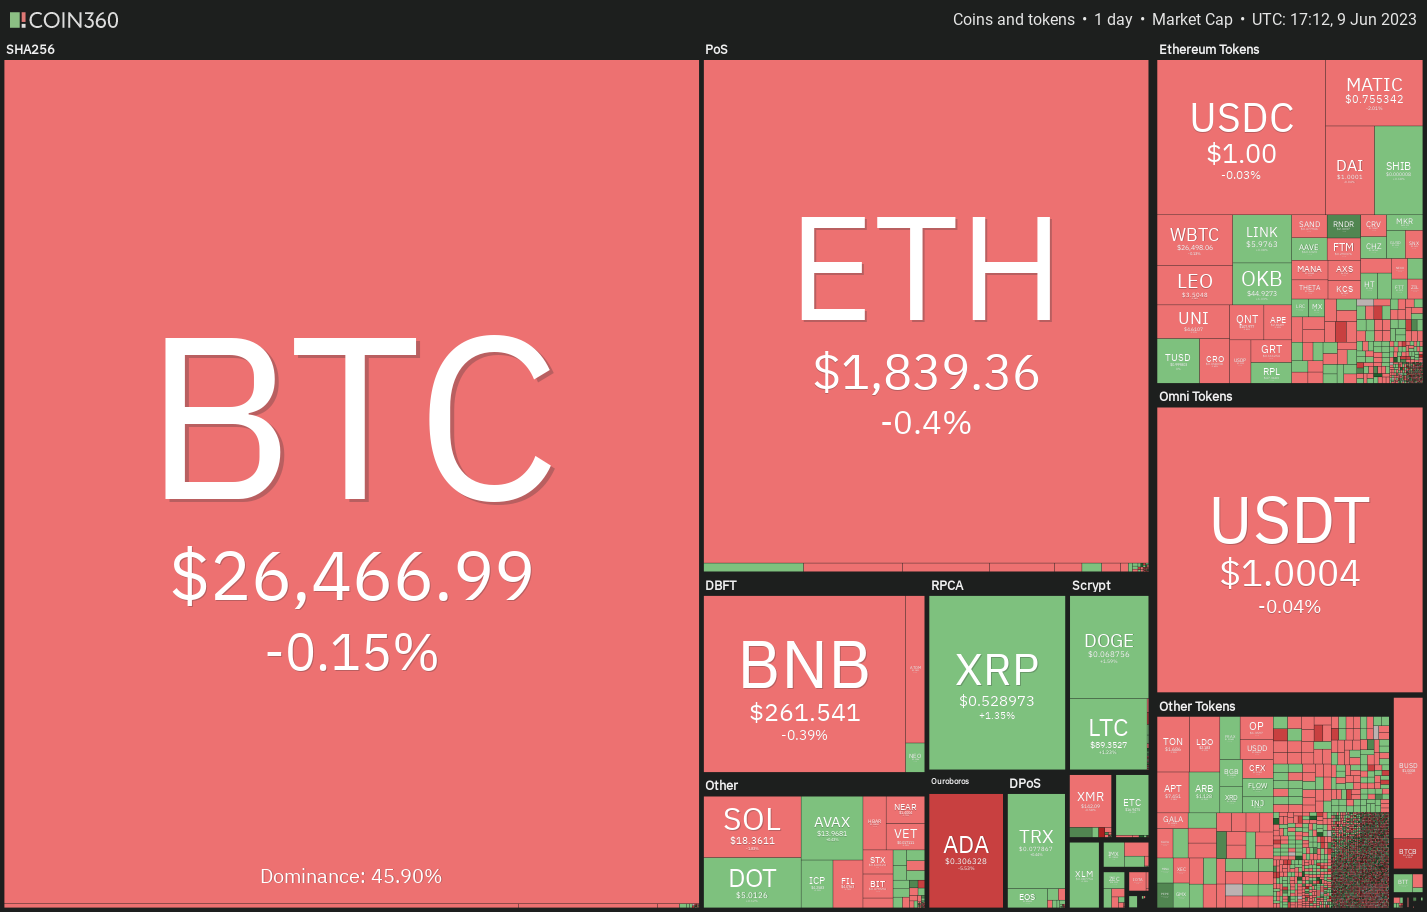
Can bulls sustain the recovery in the cryptocurrency markets or will higher levels bring out the bears in large numbers? Let’s study the charts of the top-10 cryptocurrencies to find out.
Bitcoin price analysis
Bitcoin turned down from the moving averages on June 7 but a minor positive is that the bulls did not allow the price to slump below $26,125. This suggests that lower levels are attracting buyers.
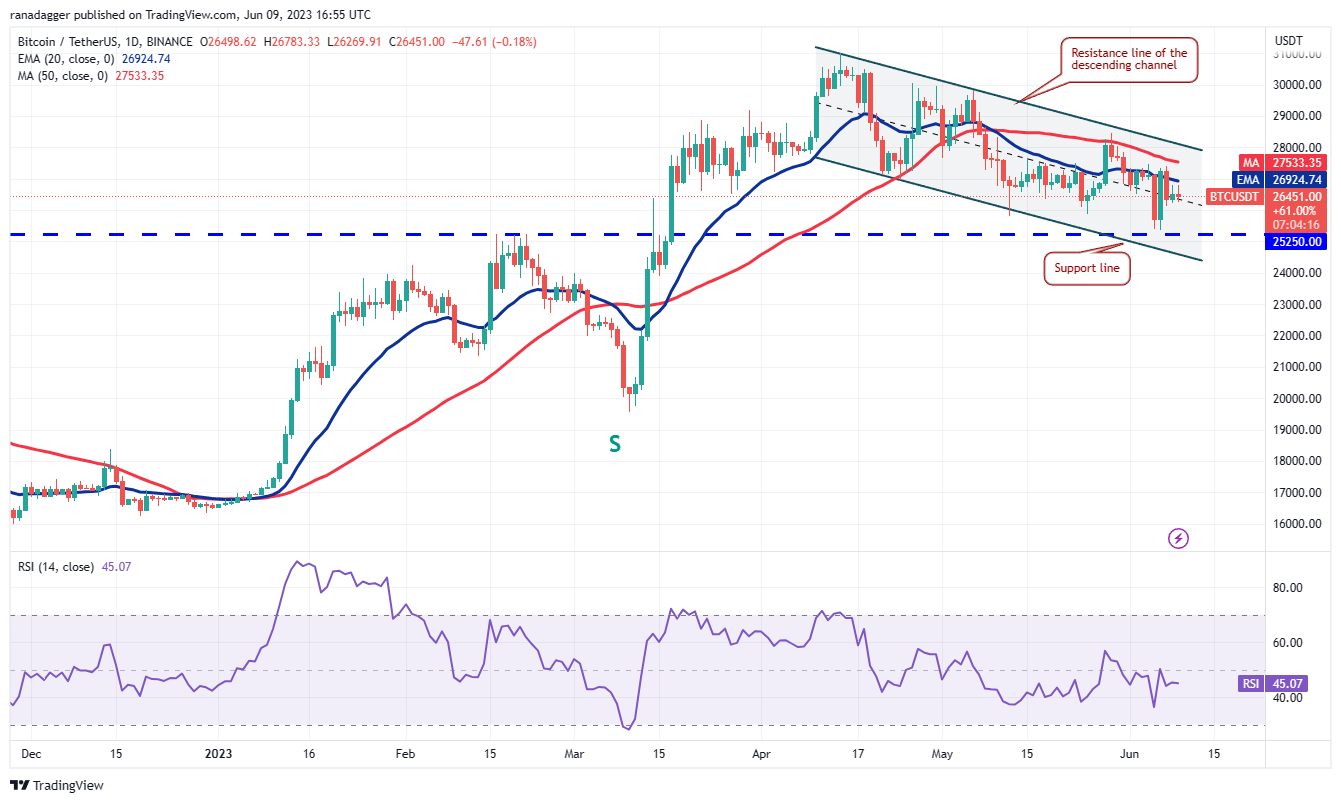
The BTC/USDT pair may then climb to the 50-day simple moving average ($27,536) and later to the resistance line of the descending channel. The bears are expected to fiercely defend this level.
Another possibility is that the price turns down from the current level. In that case, the bears will try to strengthen their position by pulling the price to $25,250. Buyers are likely to protect this level to the best of their ability.
Ether price analysis
The bulls have managed to maintain Ether (ETH) above the resistance line of the falling wedge pattern, indicating demand at lower levels.
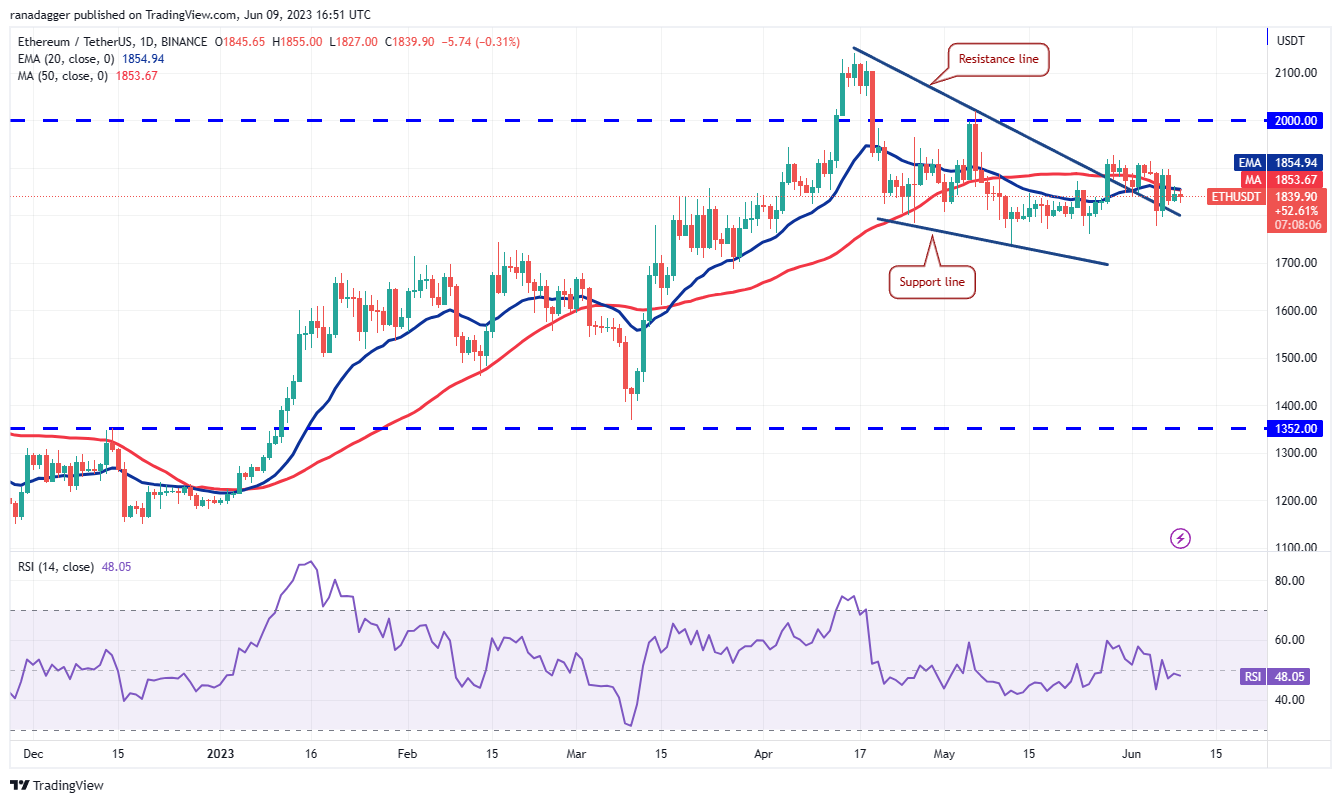
On the contrary, if buyers drive the price above $1,927, the bulls will gain the upper hand. The pair may first rise to $2,000 and thereafter dash toward the next major resistance at $2,200.
BNB price analysis
BNB (BNB) nosedived below the important support of $265 on June 7. The bulls tried to push the price back above the breakdown level on June 8 but the bulls held their ground.
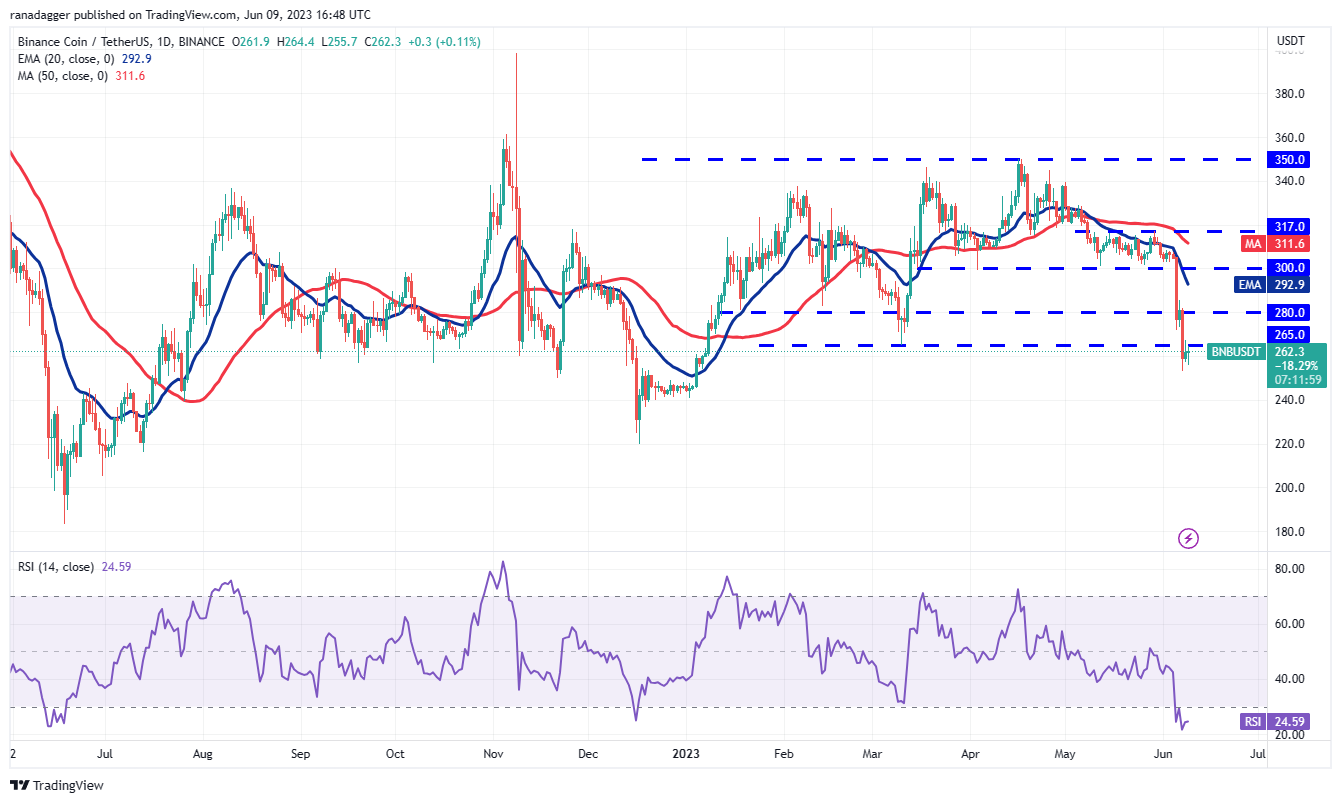
On the downside, if bears sink the price below the intraday low of $253 made on June 7, the BNB/USDT pair may extend its decline to $240 and below that to $220.
XRP price analysis
XRP (XRP) remains in an up-move. The bears tried to start a correction but could not pull the price to the 20-day EMA ($0.50) on June 7 indicating that the bulls are holding strong.
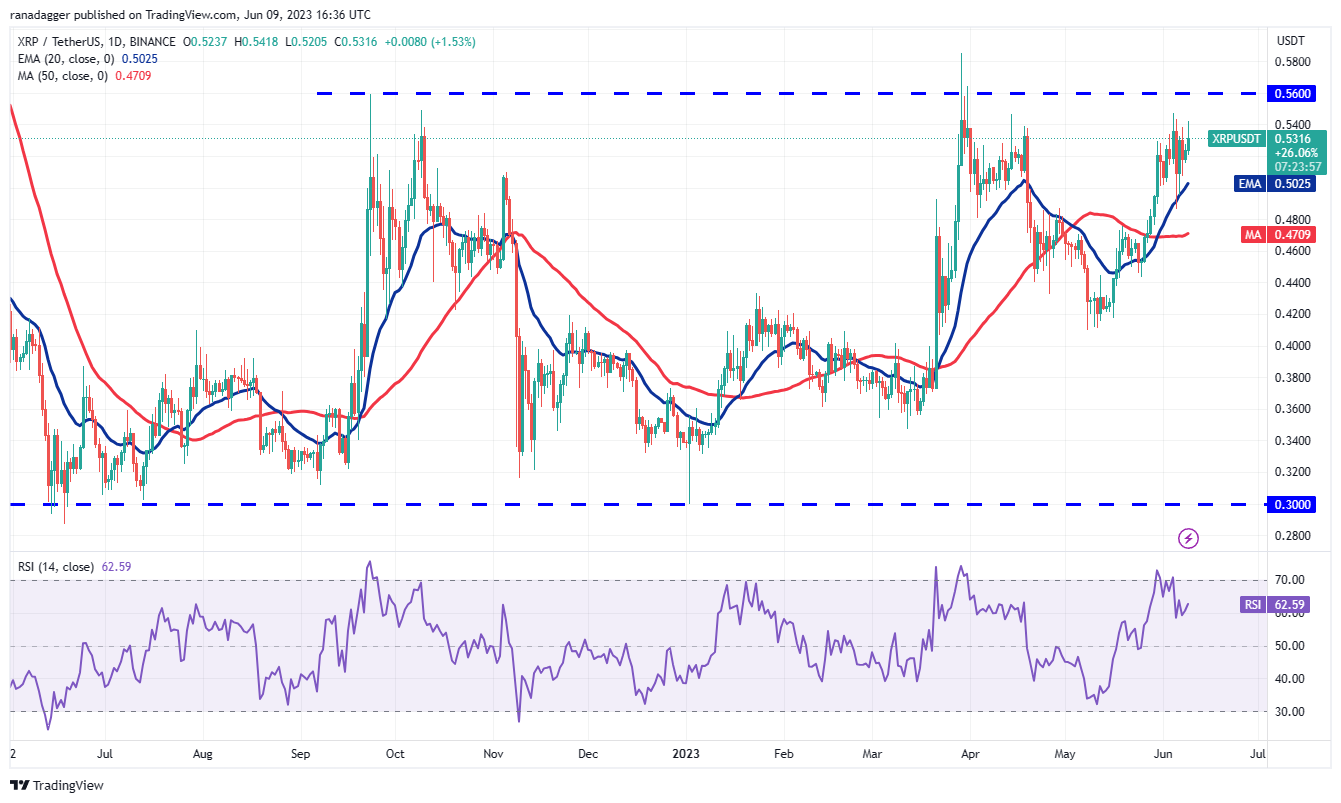
If bears want to start a pullback, they will have to tug the price below the 20-day EMA. That may attract profit-booking from short-term traders and the pair could fall to the 50-day simple moving avearge ($0.47) and later to $0.42.
Cardano price analysis
The bulls tried to start a relief rally on June 8 but the long wick on the day’s candlestick shows that bears continue to sell Cardano (ADA) at higher levels.
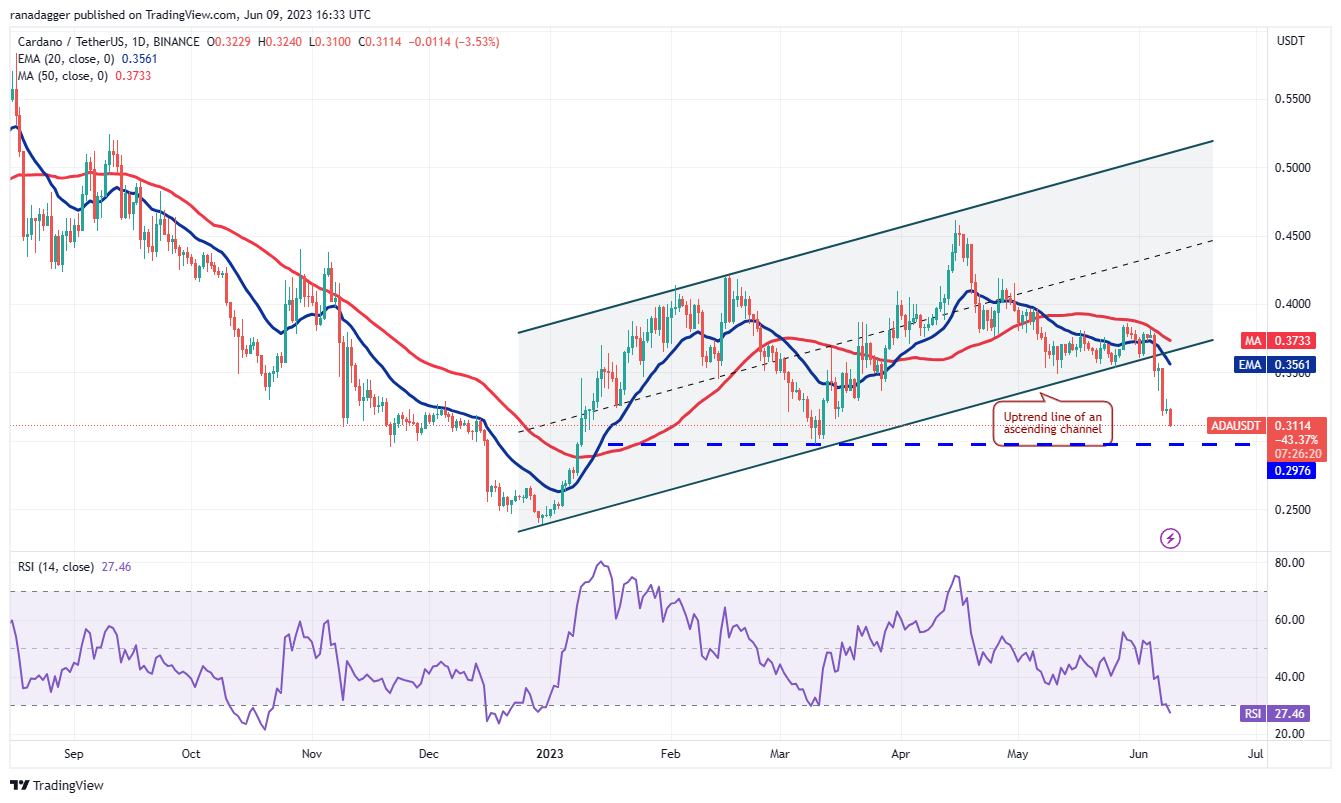
The first overhead resistance to watch out for is the 20-day EMA ($0.35). A break and close above this resistance will indicate that the selling pressure may be reducing.
Alternatively, if the price continues lower and plummets below $0.30, it will clear the path for a potential decline to $0.24.
Dogecoin price analysis
Dogecoin (DOGE) remains below the breakdown level of $0.07 but the bulls have not allowed the bears to sink the price to the next support near $0.06.
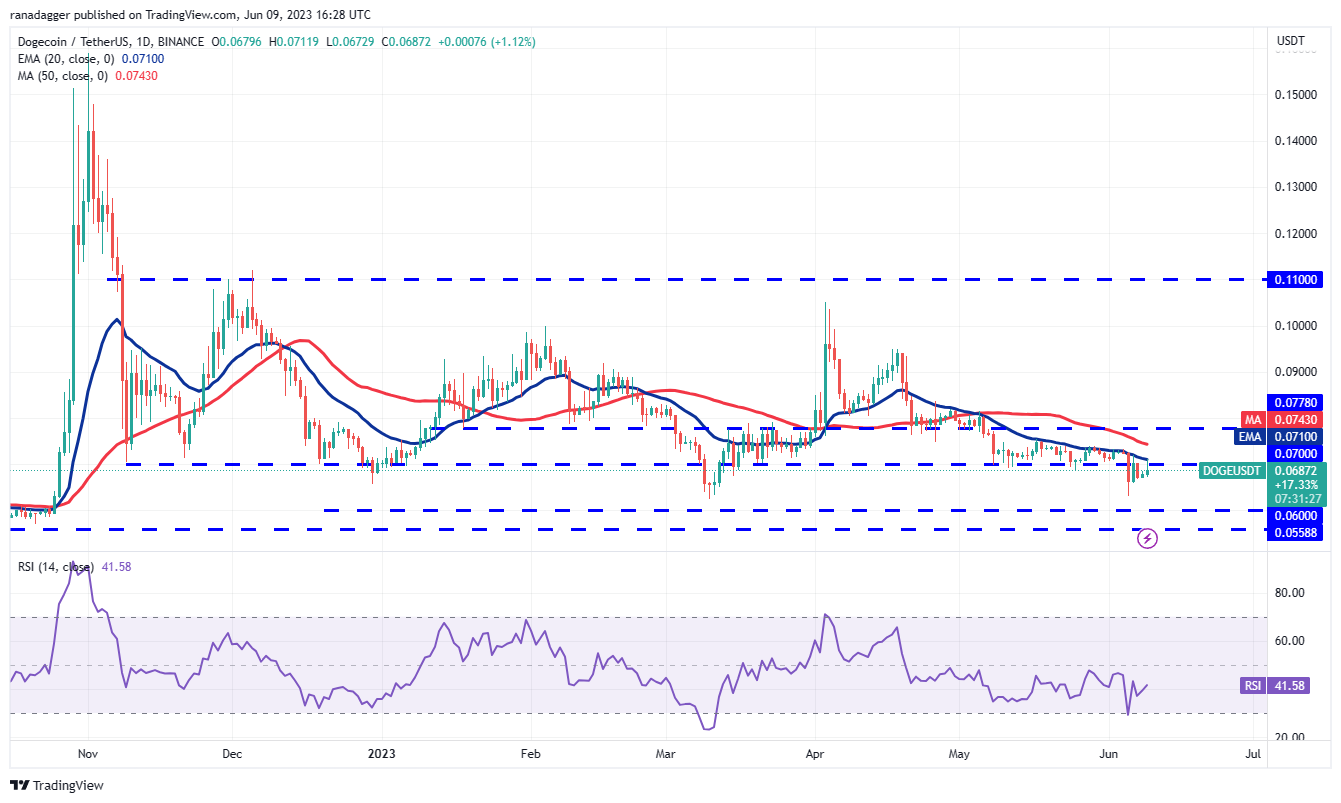
If the price turns down and continues lower, it will suggest that the bears are selling near overhead resistance levels. The DOGE/USDT pair could then dip toward the support near $0.06.
If bulls want to prevent the decline, they will have to quickly drive the price above the 20-day EMA. Such a move will suggest the start of a stronger recovery. The pair may then attempt a rally to $0.08.
Solana price analysis
Solana (SOL) dipped below the $18.70 support on June 8 but the long tail on the candlestick shows that the bulls are trying to protect the level.
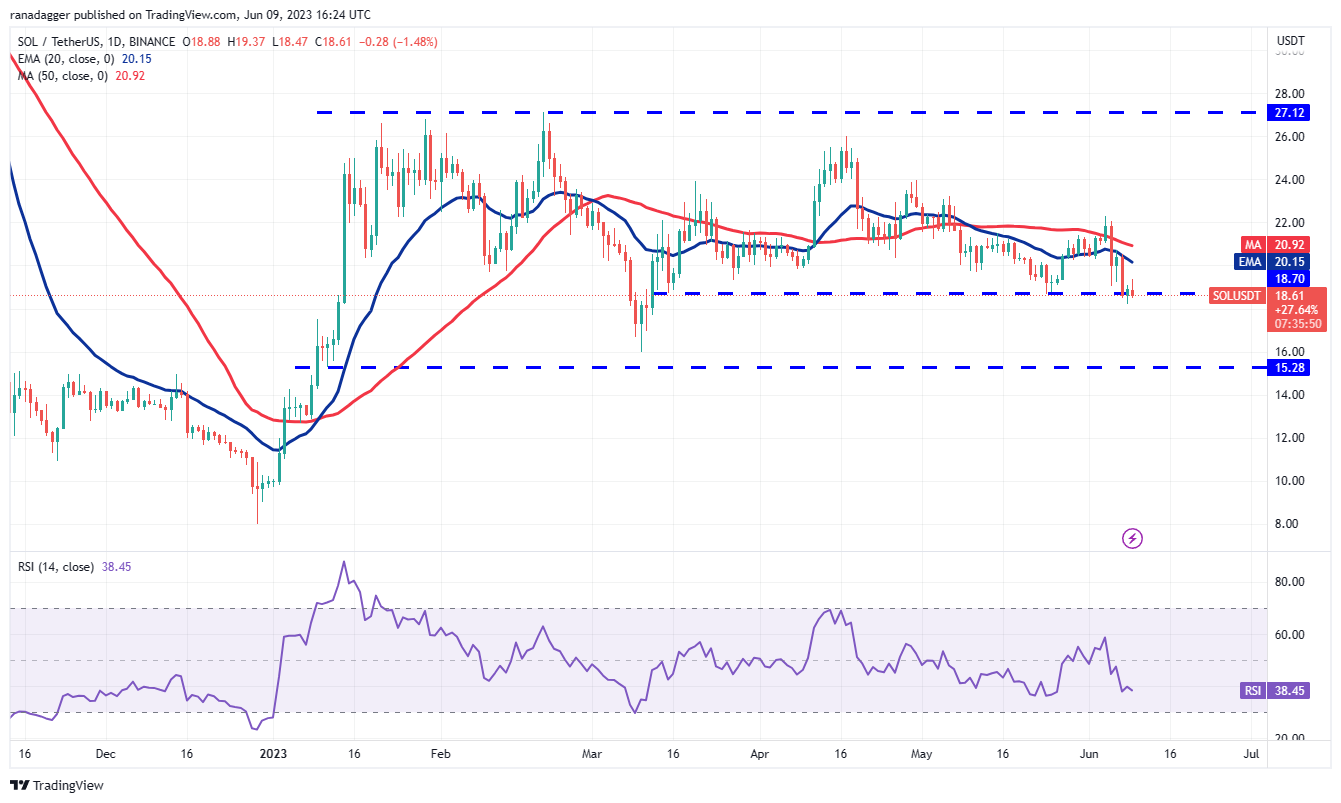
Contrary to this assumption, if the price rebounds off the current level, the pair may reach the moving averages. A break and close above the 50-day SMA ($20.92) will signal the start of a stronger relief rally toward $24.
Related: Why is Bitcoin price stuck?
Polygon price analysis
Polygon (MATIC) continues to move lower toward its crucial support at $0.69, indicating that bears are in firm control.
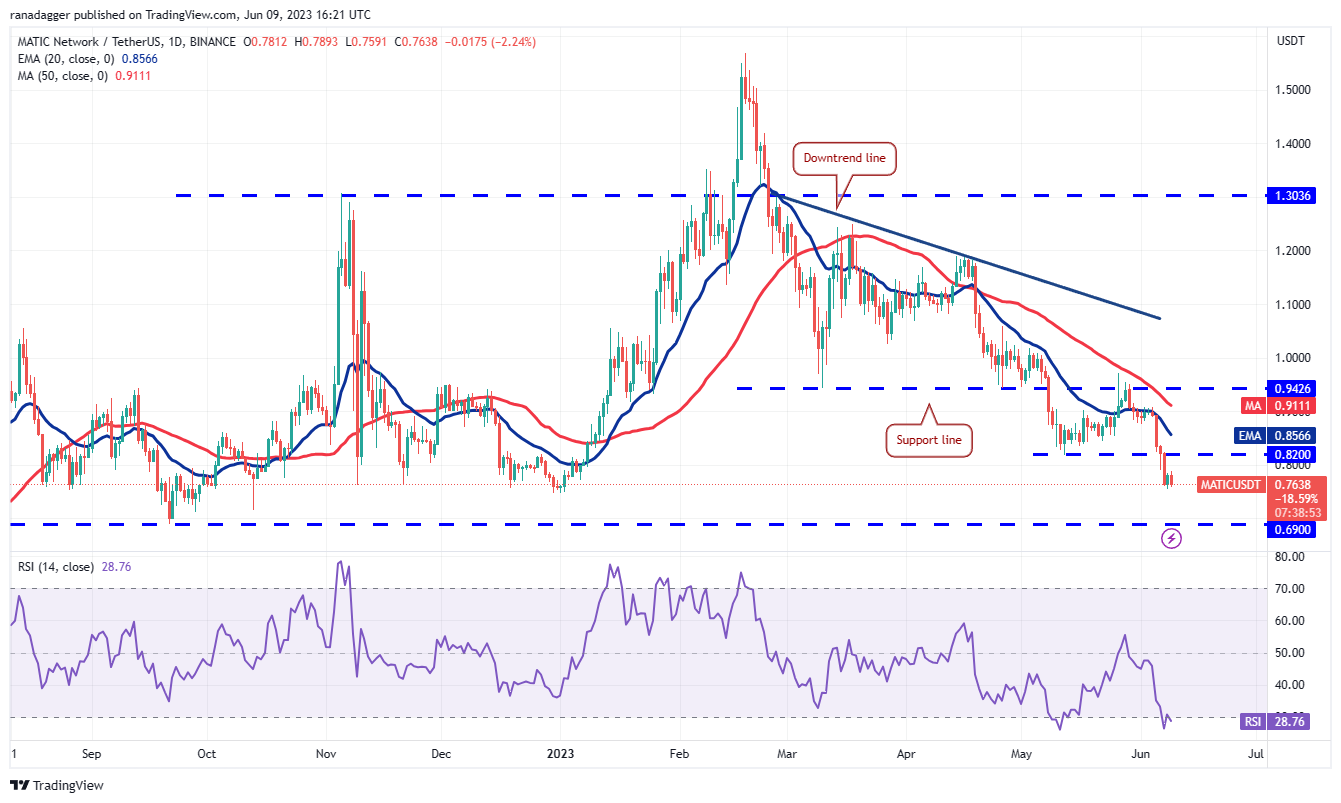
On relief rallies, the breakdown level of $0.82 is likely to act as a major hurdle. If bulls overcome this obstacle, the pair may move up to $0.94. This level is likely to witness strong selling by the bears.
Litecoin price analysis
The bulls repeatedly purchased the dip below the 50-day SMA ($88) between June 7 and 9, indicating solid demand at lower levels. However, the bears have not given up as they continue to sell Litecoin (LTC) near the 20-day EMA ($90).
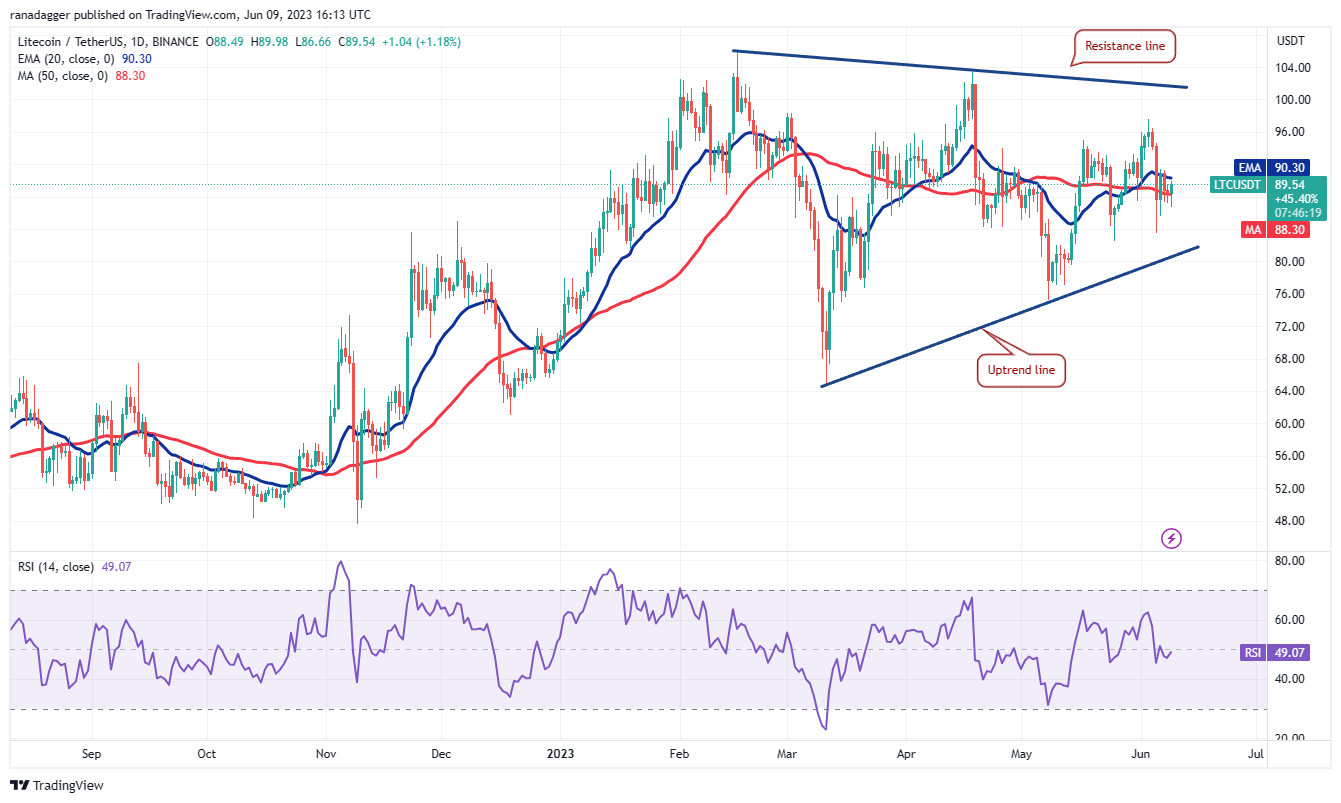
On the upside, buyers will have to push the price above the 20-day EMA ($90) to open the doors for a possible rally to the resistance line of the triangle.
The next trending move is likely to begin after the price breaks above or below the triangle. Until then, the range-bound action is likely to continue.
Polkadot price analysis
Polkadot (DOT) remains below the breakdown level of $5.15 but a minor advantage in favor of the bulls is that they have not allowed the bears to sink the price below the immediate support at $4.90.

Contrarily, if the price once again turns down from $5.15 or the 20-day EMA, it will indicate that bears continue to sell on minor rallies. That will increase the possibility of a drop below $4.90. The next major support on the downside is way lower at $4.22.
This article does not contain investment advice or recommendations. Every investment and trading move involves risk, and readers should conduct their own research when making a decision.
This article is for general information purposes and is not intended to be and should not be taken as legal or investment advice. The views, thoughts, and opinions expressed here are the author’s alone and do not necessarily reflect or represent the views and opinions of Cointelegraph.

Related Posts
 US Futures Surge After Sharp Rebound In Asia And Europe; China “Plunge Protectors” Activated
 Billion Dollar Unicorns: WalkMe’s Enterprise Focus Pays Off
 Catch These Brazil ETFs On A Rebound
 ETH/USD Establishes Itself In A High Range – More Stable Than Bitcoin?
 Tesla Inc Stock Up As Panasonic Thinks Model 3 Production Is Picking Up
 High Yield Gap Nearly Closed
Leave A Comment