
Written by John Lounsbury and Steven Hansen
The headlines say new home sales significantly improved from last month (even though last month was revised downward) – but the improvement was less than last month’s decline. The rolling averages smooth out much of the uneven data produced in this series – and this month there was a deceleration in the rolling averages.

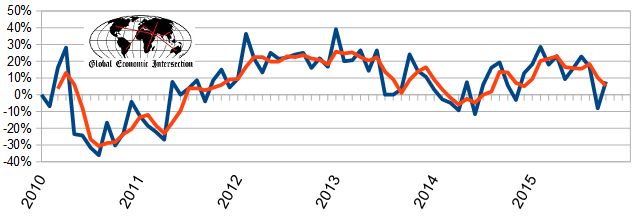
As the data is noisy, the 3 month rolling average is the way to look at this data. This data series is suffering from methodology issues. Econintersect analysis:
Unadjusted Year-over-Year Rate of Growth – Sales (blue line) and 3 1month rolling average of Sales (red line)
US Census Headlines:
The quantity of new single family homes for sale remains well below historical levels.
Seasonally Adjusted New Homes for Sale

As the sales data is noisy (large monthly variations).
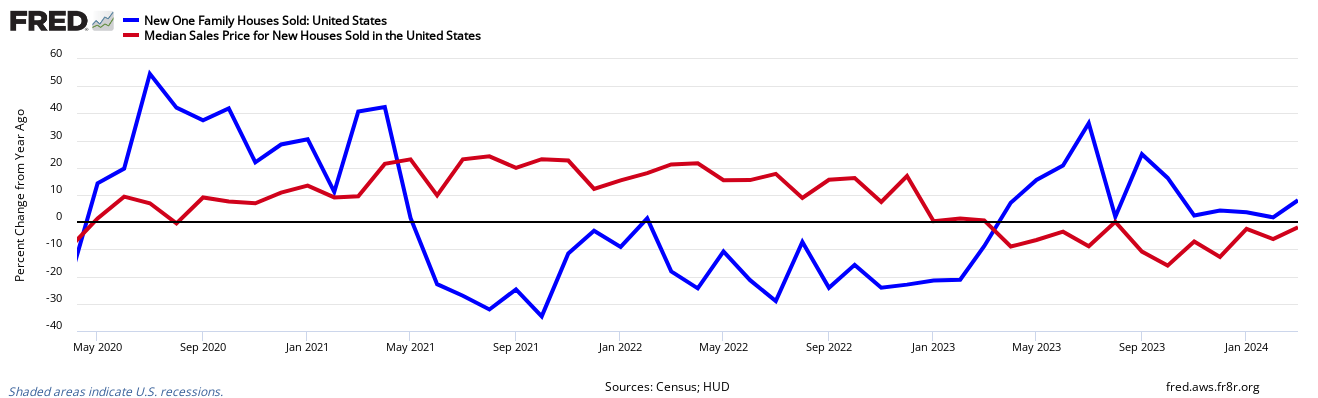
Year-over-Year Change – Unadjusted New Home Sales Volumes (blue line) with zero growth line emphasized
The headlines of the data release:
Sales of new single-family houses in October 2015 were at a seasonally adjusted annual rate of 495,000, according to estimates released jointly today by the U.S. Census Bureau and the Department of Housing and Urban Development. This is 10.7 percent (±17.7%)* above the revised September rate of 447,000 and is 4.9 percent (±17.6%)* above the October 2014 estimate of 472,000.

Related Posts
 Buy Bank, Gold, & Silver Stocks
 Bullish 2024 Outlook On Track After Four-Month Market Win Streak
 Expect Large Builds In Oil Inventories For Next 7 Weeks
 Dudley Slightly Warming Up To Hikes – USD Slides And Recovers
 Better Tech Dividend Stock: Intel Or Texas Instruments?
 Optimism transactions surpass Arbitrum, but what’s behind the uptick in users?


Leave A Comment