
Since the beginning of 2023 the S&P 500 Index is up 35.9% while at the same time the average total return of the so-called Magnificent Seven stocks is 159.1% over that same time frame. The technology heavy Nasdaq 100 index is up 64.5%. The technology sector accounts for nearly 60% of that index’s weighting. And in fact, the technology sector weighting in the S&P 500 index is nearly 30%. 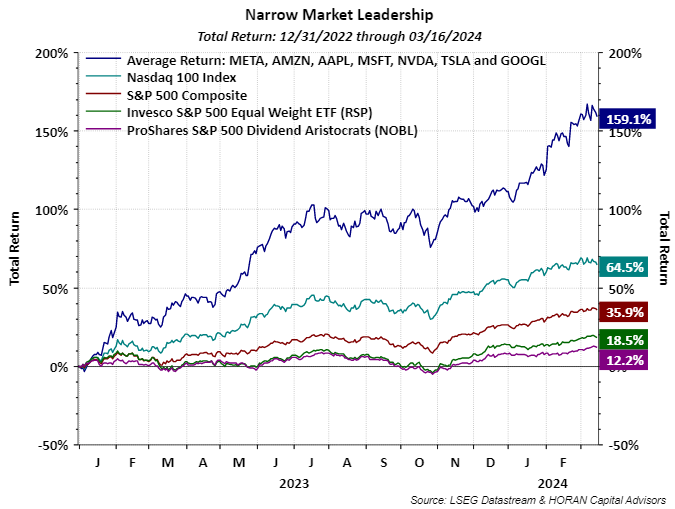 The Magnificent Seven year to date average return is 13.8% versus the S&P 500 Index return of 7.6%. Recently though the return for some of the Mag 7 stocks has weakened as seen in the below chart. Three of the stocks, Alphabet (GOOGL), Apple (AAPL) and Tesla (TSLA), have a year-to-date return that now trails the return for the S&P 500 Index.
 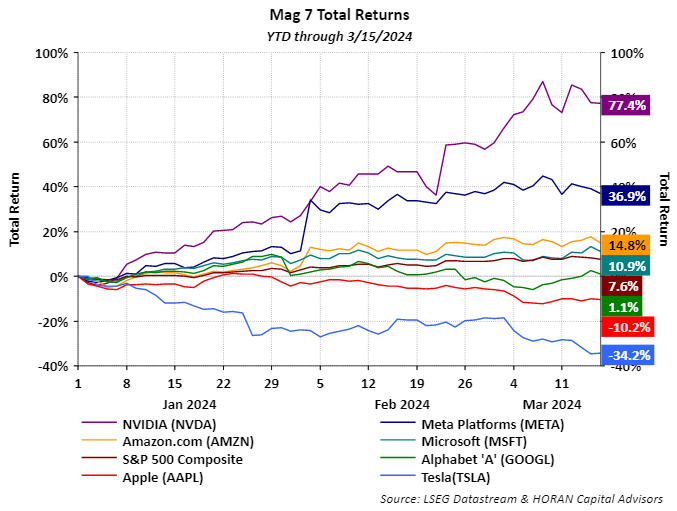 When a market leadership group begins to experience weakness, this can be a sign of a potential top in the market. This was the case last summer when the Nasdaq 100 Index experienced weakness relative to the S&P 500 Index as seen with the red boxes in the top panel in the below chart. The S&P 500 Index mostly declined through the summer of 2023 before bottoming at the end of October as seen with the chart.
 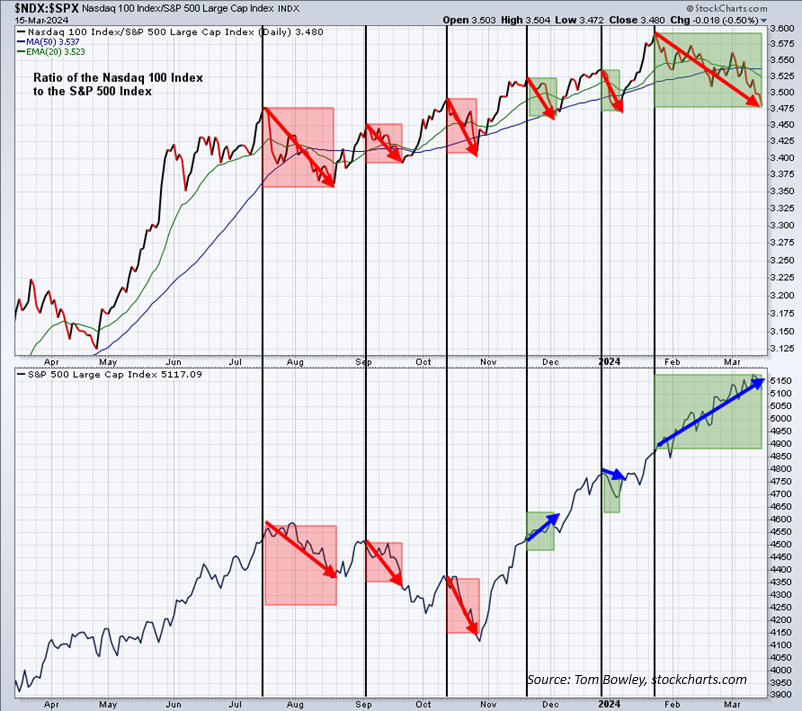 The above chart is referenced in a StockCharts.com article, StockCharts.com, and is a worthwhile read. Visible in the above chart is the underperformance of the Nasdaq 100 Index relative to the S&P 500 Index that occurred in the last three green highlighted areas on the top panel of the chart. This underperformance did not lead to weakness in the S&P 500 Index as it did last summer. What the referenced article shows is the rotation of investor funds into other stock sectors. As the previously referenced article states. “During the summer of 2023, the $NDX:$SPX ratio declined and this “risk off” signal resulted in a 10% correction as the benchmark S&P 500 followed suit to the downside. But look at the last 3 “risk off” readings in the $NDX:$SPX ratio. The S&P 500, for the most part, has kept gaining ground, especially over the past two months. What’s changed? …It’s called BULLISH ROTATION.”Having noted the favorable set up for the market or specifically the S&P 500 Index, a near term correction would not be a surprise. Seasonally the market has reached a point in time where corrections have occurred as seen in the below chart. Importantly, election year returns tend to be positive ones; however, the March to June period can experience weakness.
 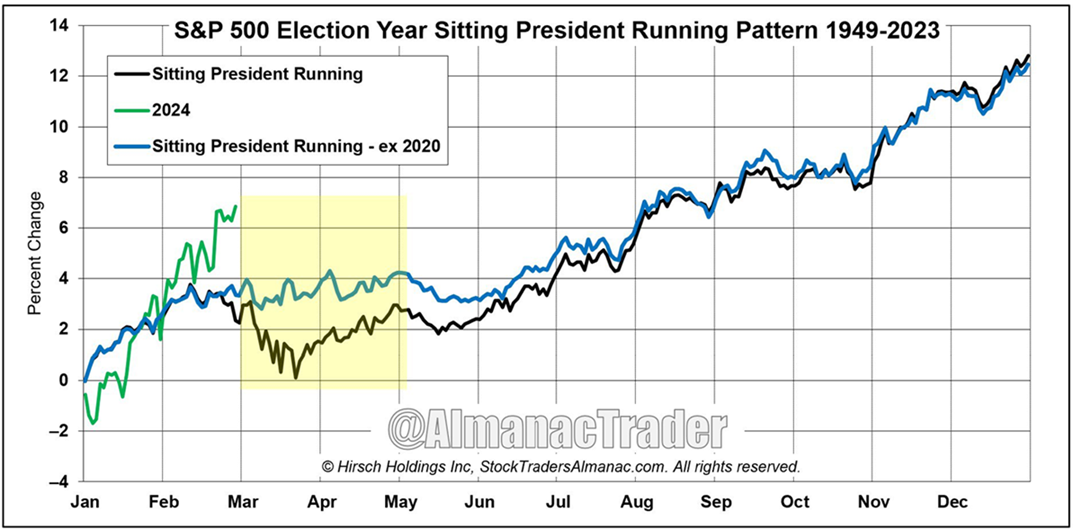 Similar seasonality is seen with the Nasdaq Composite Index.
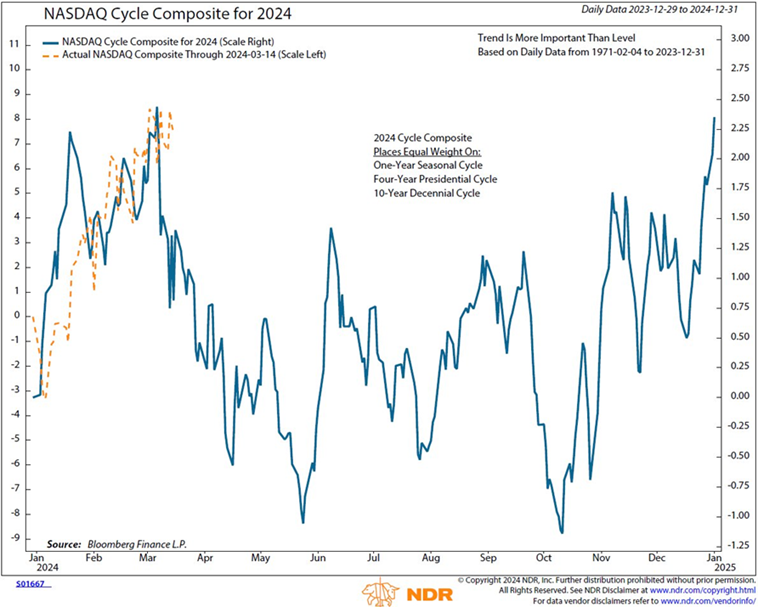 In conclusion, the market is experiencing bullish rotation where lagging sectors and stocks are attracting investor interest. However, from a seasonality perspective, near term market weakness may occur. In a recent interview of Sam Stovall, chief market strategist for CFRA Research, by Chuck Jaffe on the Money Life Show, Sam noted average market declines equal 8% following bear market recoveries. And following declines of 5-10%, on average, the market gets back to breakeven in a month and a half. And lastly, in election years when the S&P 500 Index is positive in January, like this year (+1.68%), the average gain for the entire year is 15%. One can listen to the entire Stovall interview below that begins at the 18:40 minute mark.More By This Author:Markets In A Minute – Welcome To The “Casino” The Economic Soft Landing Has OccurredImproving Individual Investor Sentiment Maybe A Near Term Risk For Equities

Related Posts
 Cardinal Health (CAH) Tops Q3 Earnings, Miss On Revenues
 So, Bill Ackman Makes Some Good Points On The Index Bubble…
 Markets Take Another Hit On U.S. Jobs Data, Oil Weakness
- Agriculture Markets Report – Friday, Dec. 1
 EURUSD: Vulnerable But With Caution
- NFTs liberate imagination: The gender gap that needs to be addressed


Leave A Comment