

Explanations for Tuesday’s market rip higher are initially hard to explain.
The Philly Fed President Harker stated late Monday he expected two to three interest rate hikes in 2016. The theme had been, if so, this wouldn’t be bullish for markets. Meanwhile other regional Fed governors, Boston, New York, Chicago, Minneapolis, Dallas, Philadelphia, Atlanta and St Louis recommended keeping the discount rate unchanged.
But with expectations increasing for higher rates the dollar moved higher on weaker expectations from Europe and Japan. This action drove down gold and other commodities but not crude oil which rose on declining rig data.
Let’s remember the largest weights in the S&P for example are Technology, Financials and Energy. All three gained on the day. Tech gained since higher interest rates historically would drive money to the best earnings sector. The same would apply to financials/banks since higher interest rates means better earnings on deposits and lending. And, with oil prices stronger that sector rose as well. So “presto” up we went as another short squeeze was at hand.
Economic data was mixed as the Richmond Fed Manufacturing Index fell to -1 vs prior 14 and into contraction. On the other hand, New Home Sales soared to $619K vs 531K with spring weather the likely cause. And, regarding housing it’s important to note the what’s going on with what you can only call “bicoastal” housing inflation. Fly-over country data doesn’t matter naturally. That provides the Fed with enough data to dilute the overall data so as to not feature housing inflation data. But it features where high paying jobs are combined with high cost housing.
As indicated stocks rallied across the globe but clearly not supported by volume reflecting weak participation once again.
Below is the heat map from Finviz reflecting those ETF market sectors moving higher (green) and falling (red). Dependent on the day (green) may mean leveraged inverse or leveraged short (red).

Related Posts
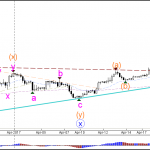 GBP/USD Retracement Returns To 38.2% Fibonacci At 1.2750
 January Goods Trade Balance Dives
 Here’s why bears aim to keep Bitcoin under $29K ahead of Friday’s $640M BTC options expiry
 Passive Investing Isn’t Hurting The Economy
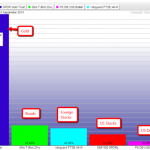 Financial Markets Week In Review: September 14-18
 Weekly Trading Forecast: All Eyes Still On The Federal Reserve


Leave A Comment