
Last Thursday’s signals were not triggered, as none of the key levels were ever reached.
Today’s BTC/USD Signals
Risk 1.00% per trade.
Trades may only be entered before 5pm New York time today.
Long Trades
The best method to identify a classic “price action reversal” is for an hourly candle to close, such as a pin bar, a doji, an outside or even just an engulfing candle with a higher close. You can exploit these levels or zones by watching the price action that occurs at the given levels.
BTC/USD Analysis
Last Thursday I was still maintaining a bullish bias even though it was starting to look as though the upwards movement was slowing down considerably. Although the short-term trend was running out of steam, I pointed to the support level as crucial – it was not even touched, and the price went on to make a strong bullish breakout and rise by more than $1000 to touch a new all-time high just below $9750.00. Along the way, two new levels were flipped from short-term resistance to become probable support, at $8976.00 and $9362.32.
The number one issue today is how close the price is to the psychologically huge price of $10,000. If the price is reached, we can expect a big reaction, either a sharp move down or a drive even higher on increasing momentum. This is typical when a hot new stock reaches such a significant number, and it is appropriate to compare Bitcoin to a hot new stock. At the time of writing, the price got to just short of $9750.00 and then had its strongest fall within an hour for about three weeks.

Related Posts
 Traders Panic-Buy Stocks Into The Close Despite Crude And Credit Crumble
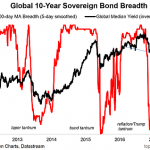 Global Bond Market Breakdown
 Sensex Plunges 1000 Points Amid Global Sell-Off; Tata Motors Cracks 7.2%
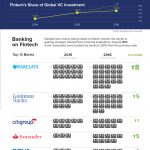 Chart: Fintech Investment In 2016
 “Due To Popular Demand” Goldman Starts Covering Bitcoin
 EU Bullet Report – EUR/USD Rallies To Multi-Month High As Markets Await Fed Chair Yellen


Leave A Comment