
Economists have developed two theoretical measures of how the American economy is performing.
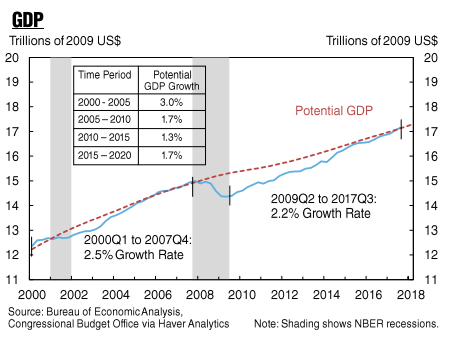
The CBO’s output gap is a measure of the difference between actual real GDP and the maximum potential output. A positive output gap means economic growth is above the longer-run trend rate and is in theory inflationary. Depending upon the size of a negative output gap, an economy could be in a major downturn. The potential growth rate of the U.S. economy as estimated by the CBO was 1.7% per year for the period 2015 to 2020.
A counterpart labor market measure is the natural rate of unemployment, and the CBO estimates the natural rate at roughly 4.7% of the labor force.
As the first chart illustrates, in the third quarter of 2017 U.S. real GDP was 0.2% above the CBO’s estimate of real potential output. Obviously, the latest 4.1% unemployment rate is considerably below the CBO estimate of the natural rate.
While both measures signal a tight economy and a tight job market, nonetheless industrial capacity utilization is still low by historical measures.
As the second chart below indicates, real business investment in machinery took off in the third quarter. In fact, real business investment in equipment increased by 6.2% over the year and the growth was solid among all the major sectors of equipment.
Nonetheless, equipment investment has been relatively sluggish over the past three years.
The second chart also suggests that an acceleration of equipment investment usually takes off after capacity utilization exceeds 80%. Capacity utilization is still considerably below that level.
The bottom line is that, based on these statistics, the American economy still has some non-inflationary slack left.


Leave A Comment