
In my last couple of articles on global equities, I made the point that various breadth and sentiment metrics were indicating a rally lay in our immediate future and we could look forward to a decent bounce in the S&P500 (SPY). That expectation proved to be correct and we have now rallied above initial resistance, gaining just under 2% for the week and clawing back a 6% loss to finish the month in positive territory, something that has happened only 8 times since 1970.
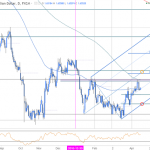
The key test now comes this week, with a retest of that initial resistance area in the 1930-1945 SPX region in play, and the bulls hoping that what was resistance now turns into support. For charting purposes I am using the SPY ETF where that same support area comes in at 193-194.50 and we must now hold above 190 at all times – the daily chart is below:

The current rally is very similar to the once we saw in September in terms of form and the technical picture. RSI, MACD and the STOCHASTICS all have a near identical look to them and as long as support holds I am expecting a similar outcome – namely a decent rally back up towards the highs over the next few weeks. Target zone #1 looks to be feasibly attainable.
Looking out into March and our future expectations for how high this rally can take us, there are a few things that stand when reviewing the technical backdrop. The first is that we have now had a bearish cross of the 8 & 34 month moving averages in the Value Line Geometric (XVG) chart, an event that has been a super-reliable indicator that an extended decline is about to unfold; and the second is that we have had a cross below the zero line of the Coppock Curve in the S&P500 (SPX) on the monthly timeframe.

Both of these indicators have been harbingers of doom in terms of the indices, and sharp declines have followed without fail every time we have had confirmed buy or sell signals since the late eighties. It is therefore not looking too good in respect of performance this year, and unless something dramatic happens to radically improve the moving averages I think we should be looking lower into the autumn once this current run higher completes.

Related Posts
 GBPAUD Range Break To Determine Next Leg- Constructive Above 1.62
 3 reasons why Bitcoin miners are selling BTC — and why it’s not capitulation
 SP 500 And NDX Futures Daily Charts – Roll Over Rover
 Daily Market Digest: FOMC Minutes, Australia Jobs Report, UK Retail Sales
 Goldman: Sorry, Bitcoin Is Not ‘Taking Demand From Gold’
 Budget Deficit Mania And The Congressional Budget Office


Leave A Comment