Gold is trading 1.15% higher on the day around $1222/Oz levels. The metal has breached resistance at $1220 … for now, but what we need is a daily close above $1220.
Daily chart
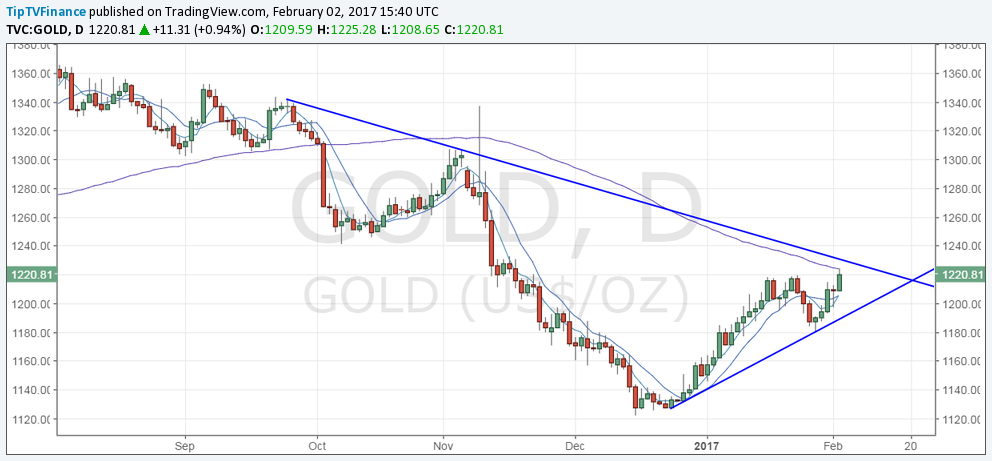
Potential daily close above $1220 would establish higher lows and higher highs formation, despite which we feel it is advisable to stay on the sidelines as the downward sloping 100-DMA is offering resistance. The next resistance is lined up at $1231 (descending trend line). A violation there would expose hurdle at $1241.50.
It is quite clear that multiple resistance levels are lined up at short distance from each other.
Fresh buyers are seen coming-in only if the descending trend line is breached.
Failure to hold above $1220 could yield correction to $1200. Only a daily close below $1180.74 (Jan 27 low) would signal the uptrend from the December low of $1122 has ended.
FTSE 100 – Short-term bottom in place, cautiously bullish
Daily chart

Wednesday’s bullish inverted hammer around the key psychological level of 7100 coupled with today’s bullish follow through suggests the pull back from Jan 16 high of 7354 has ended and the index could revisit 7205 levels (Jan 25 high).
On the downside, a daily close below 7100 would signal the pull back from 7354 has resumed.
Despite the short-term bullish outlook, caution is advised as despite having clocked fresh record high of 7354 the index ended January below the previous record high of 7130. The aforesaid price action is a sign of bullish exhaustion.


 EC
Ruth Chris Revival Looks Well Done
EC
Ruth Chris Revival Looks Well Done This Is Exactly What The Early Phases Of A Market Meltdown Look Like
 EUR/USD Forex Signal: Bullish Outlook In A Thin Market


Leave A Comment