
For analyzing the best pairs to trade looking from a longer term perspective the last 3 months Currency Classification can be used in support:
Strong: JPY, CAD, CHF. The preferred range is from 6 to 8.
Average: USD, AUD, NZD. The preferred range is from 3 to 5.
Weak: EUR, GBP. The preferred range is from 1 to 2.
The charts were provided in the article: “Forex Currency Score Classification for Wk20”.
______________________________________
13 Weeks Currency Score Strength for Week 21 / 22 May 2016
The 13 Weeks Currency Strength and the 13 Weeks Average are provided here below. This data and the “3 months currency classification” are considered for deciding on the preferred range. Because it is not ideal nor desired to change the range for a currency every single week, we perform several checks to avoid this.

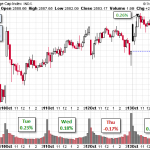
The AUD and the CHF are close to each other with their score. When looking at the Weekly TA Chart it is clear to see that this pair is consolidating.

______________________________________
Currency Score Comparison for Week 21 / 22 May 2016
“Comparison table” and the “Ranking and Rating list”
By using the comparison table directly below you can get a view without the volatility and statistics as opposed to the “Ranking and Rating list”. Only the strength of each currency against the counterparts is analyzed by using the Technical analysis charts of the 4 Time Frames that are also used for the “Ranking and Rating List”.
The information from the Comparison Table is the source for calculating the “Ranking and Rating List” where this list uses additionally the volatility and statistics for creating the best and worst performer in the list from number 1 to 28.

Related Posts
 Dollar Faces Crucial Bearish Test, ECB And China Event Risk
 How Low Can Nat Gas EOS Go?
 December 2017 Headline Wholesale Sales Improved
- 4 Technology Stocks In The Spotlight Ahead Of Thanksgiving
 S&P 500 Snapshot: Up 14% YTD
 Rising Inflation Expectations, Rising 10-Year Treasury Yields (Reason To Worry Or Not?)


Leave A Comment