
U.S. Versus The World
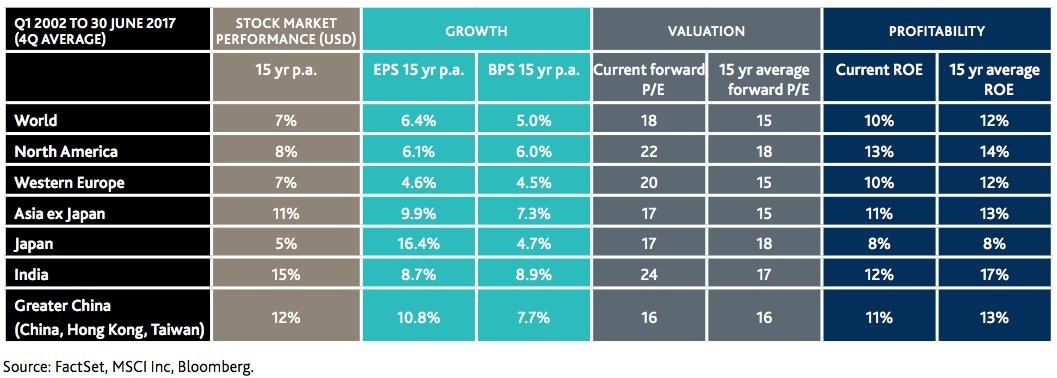
With the stock market reaching another record high let’s look at valuations across the globe. As you can see from the chart below, North America has the second highest current P/E ratio and the highest forward P/E ratio. North America has a relatively low 15-year earnings growth rate and book value growth rate which doesn’t justify the high P/Es. The one bright side is that North America has the highest return on equity and the second highest 15-year return on equity average. Despite this expensive valuation, America has a relatively meager 15-year average return on stocks as the over 50% drop in the financial crisis hurt gains.
While North America has had meager 15-year returns, in the past few years the U.S. has outperformed the world average as emerging markets have underperformed. The chart on the right shows the MSCI global index with and without the U.S. There is a 110% outperformance showing how much of an impact America has had on global stocks. The chart on the left explains the result of America’s outperformance as it now has a 53% weighting in the MSCI world index despite its 24% contribution to global GDP. The misleading part of that chart is that American companies get 30% of their sales from abroad. Therefore, if you multiply the 53% weight by .7 you get the actual weight the American economy has. That gives a 37.1% weighting.
37.1% is still higher than 24%, meaning it is still over-indexed. This happens anytime a stock or a group of stocks does well. Apple for example, is in growth and value indexes because it is successful. This indexing leads to accelerated forced selling when the trend reverses. The question is if the U.S. will lead to a selloff abroad. The most likely way for a rebalancing might be if after the selloff is done, the emerging markets begin to outperform. It’s not that simple because Brazil has political instability and China is in a credit bubble. As you can glean, a credit bubble artificially inflates GDP growth which distorts the comparison to the index. For example, America’s stock market might not be overweighted, but instead the Chinese economy might be overweighted in the measurement of its contribution to global GDP.

Related Posts
 Bitcoin price sets up for an explosive move as ADA, XLM, AAVE and CFX turn bullish
- Why This 23% Rally In 20 Days May Not Be Over With
- An Early Warning Sign Or Another Buy Signal?
 Swiss Central Bank Sent A Warning To The World
 Trade Deficit Steepens Led By China: Top Six Offenders
- Brandon Smith: The Controlled Demolition Of Our Economy


Leave A Comment