The GBP/USD managed to recover on Powell’s relatively dovish words on Friday, but a recovery will be hard to stage.
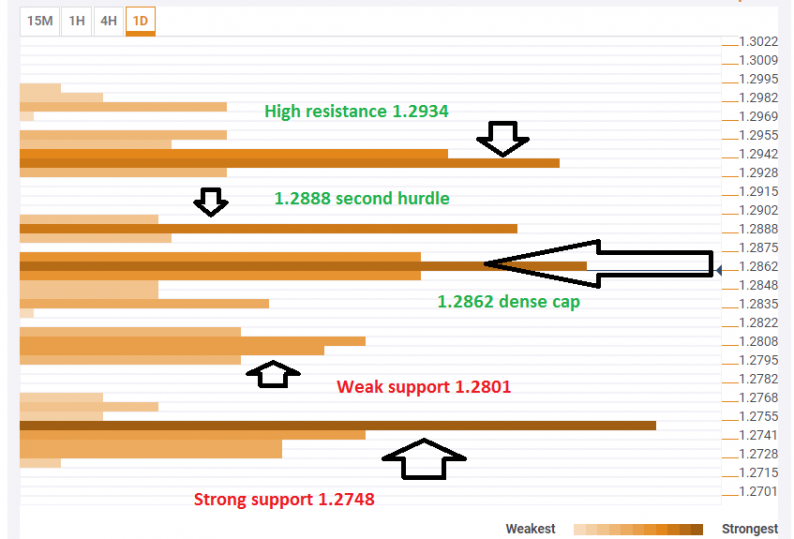
The Technical Confluences Indicator shows that cable faces a dense cluster of resistance levels at around 1.2862. This includes the Bolinger Band 15m-Middle, the Simple Moving Average 10-15m, the SMA 5-1h, the Fibonacci 38.2% one-week, the Fibonacci 23.6% one-day, the BB 15m-Middle, the SMA 100-1h, the BB 4h-Middle, the BB 1h-Upper, the Fibonacci 38.2% one-day, and a few additional lines.
Should the pair overcome this hurdle, 1.2888 is another cap that consists of the BB one-day-Middle, the Fibonacci 23.6% one-week, and the one-day high.
Next up, we find 1.2934 which is the convergence of the BB 4h-Upper, the Pivot Point one-month Support 1, the PP one-day Resistance 2, and last week’s high.
Looking down, weak support awaits at 1.2801 where we see the confluence of the SMA 200-1h, the BB 4h-Lower, the SMA 50-4h, the Fibonacci 61.8% one-week, and the Pivot Point one-day S1.
Substantial support awaits only at 1.2748 which is the convergence of the Pivot Point one-month Support 2, the Fibonacci 161.8% one-day, the PP one-week S1, and last week’s low.
This is how it looks on the tool:

Confluence Detector
The Confluence Detector finds exciting opportunities using Technical Confluences. The TC is a tool to locate and point out those price levels where there is a congestion of indicators, moving averages, Fibonacci levels, Pivot Points, etc. Knowing where these congestion points are located is very useful for the trader, and can be used as a basis for different strategies.
This tool assigns a certain amount of “weight” to each indicator, and this “weight” can influence adjacents price levels. This means that one price level without any indicator or moving average but under the influence of two “strongly weighted” levels accumulate more resistance than their neighbors. In these cases, the tool signals resistance in apparently empty areas.


Leave A Comment