
GBPUSD Elliott Wave Analysis Trading Lounge 4 Hour Chart, 8 December 23British Pound/U.S.Dollar (GBPUSD) 4 Hour ChartGBPUSD Elliott Wave Technical AnalysisFunction: TrendMode: impulsiveStructure: red wave 5 of 3Position: black wave 3Direction;Next Higher Degrees: red wave 5(started)Details:red wave 4 of blue wave 3 looking completed at 1.25442 Now wave red 5 of 3 is in play . Wave Cancel invalid level: 1.25092The “GBPUSD Elliott Wave Analysis Trading Lounge 4 Hour Chart” dated 8 December 23, provides a detailed analysis of the British Pound/U.S. Dollar (GBPUSD) currency pair within a four-hour timeframe. Utilizing Elliott Wave principles, the analysis aims to offer traders insights into the current market trends, corrections, and potential future movements.The identified “Function” of the market is labeled as “Trend,” emphasizing a focus on recognizing and capitalizing on the existing directional movement. This aligns with the broader goal of understanding and trading in the direction of the prevailing trend.The market “Mode” is characterized as “impulsive,” indicating a dominant phase of strong and decisive price movements. Impulsive phases are often associated with the main trend and can present lucrative trading opportunities for those looking to ride strong directional moves.The primary “Structure” is identified as “red wave 5 of 3,” providing information about the ongoing impulsive wave within the larger Elliott Wave structure. This is crucial for traders to comprehend the current phase within the broader market context.The specified “Position” is denoted as “black wave 3,” offering insights into the current wave count within the overarching Elliott Wave sequence. Understanding the current position helps traders assess the potential risk and reward of their trades.In terms of “Direction; Next Higher Degrees,” the projection is “red wave 5 (started),” indicating that the fifth impulsive wave within the larger structure has begun. This provides a forward-looking perspective for traders preparing for potential market movements.The “Details” section highlights that “red wave 4 of blue wave 3” is considered completed at 1.25442. This suggests the end of a corrective phase within the context of the third wave, with “red wave 5 of 3” now in play, signifying a potential resumption of the overall trend.The “Wave Cancel invalid level” is identified as “1.25092.” This level is crucial as it represents a point at which the current wave count would be invalidated, prompting a reevaluation of the prevailing market conditions.In summary, the GBPUSD Elliott Wave Analysis for the 4 Hour Chart on 8 December 23, indicates an impulsive phase labeled as “red wave 5 of 3.” The analysis provides insights into the wave structure, position, expected next wave, and a crucial level for potential wave cancellation within the broader trend. Traders can leverage this information to make informed decisions aligned with the prevailing market dynamics. More By This Author:Elliott Wave Technical Analysis: Visa Inc.
Elliott Wave Technical Analysis 4 Hour Chart: New Zealand Dollar/U.S. Dollar – Thursday, Dec. 7
Elliott Wave Technical Analysis Day Chart: New Zealand Dollar/U.S. Dollar – Thursday, Dec. 7

Related Posts
 Jimmy Carter And The Energy Crisis That Never Happened
 Lack Of Serious Competition Will Allow Adobe To Fly Higher This Year
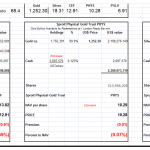 NAV Premiums Of Certain Precious Metal Trusts And Funds – Thursday, April 6
- September 12th Binary Options Asset Insights
- An Inflation Indicator To Watch, Part 3
 Gasoline Soars On Harvey Disruption, Crude Falls Despite Big Draw


Leave A Comment