The dollar exchange rates of the metals fell this week, with that of silver falling more.
Friday’s trading action was notable, because at first markets (including the US stock market) interpreted comments by Fed Chair Janet Yellen as “dovish”—i.e. low interest rates will continue. This means rising money supply, and everyone “knows” that means rising prices. Especially of assets such as stocks and gold and silver.
But then Fed Vice Chair Stanley Fischer gave reiterated that the Fed may hike rates in September. This means a shrinking money supply, or at least a slow in the rate of growth. Therefore… sell. And the markets dutifully did.
When these gyrations are happening, it’s easy to get caught up in them. However, at the end of the day (literally, in the case of Friday) the falling silver price trend continued. These media appearances do not usually change the supply and demand fundamentals.
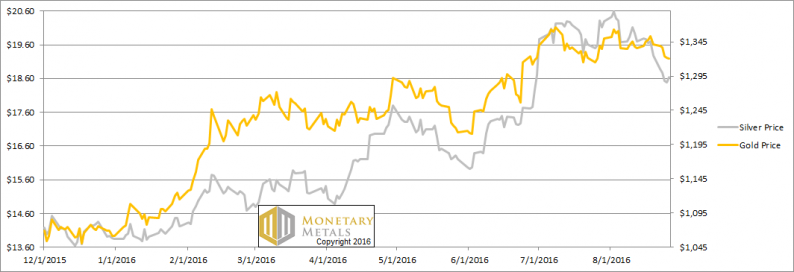
Speaking of supply and demand fundamentals, read on for the only the only true picture. But first, here’s the graph of the metals’ prices.
The Prices of Gold and Silver

Next, this is a graph of the gold price measured in silver, otherwise known as the gold to silver ratio. It rose over a point this week.
The Ratio of the Gold Price to the Silver Price

For each metal, we will look at a graph of the basis and cobasis overlaid with the price of the dollar in terms of the respective metal. It will make it easier to provide brief commentary. The dollar will be represented in green, the basis in blue and cobasis in red.
Here is the gold graph.
The Gold Basis and Cobasis and the Dollar Price

We haven’t seen this in a while. The gold basis crossed the cobasis. We actually had backwardation (temporary though it may be, as selling pressure on the October contact has already begun, due to the roll).
Unlike the market price, the calculated Monetary Metals fundamental price was up this week. It’s now 45 bucks above the market, the first time that fundamental > market since April.

Related Posts
 Campbell Soup Confirms Acquisition Of Snyder’s-Lance For $50 Per Share In Cash
- Growth Or Inflation?
 Sentiment Survey: Furious Bulls
- U.S. Congressman wants to scrub bill provision that crypto advocates say is a potential disaster
 War Concern Peaked, But Did Gold Price Peak?
- 3 Value Stocks To Buy Ahead Of 2018


Leave A Comment