
Faith in the Federal Reserve’s commitment to raising rates has thus continued to weigh down gold prices. Investors are heeding the Fed’s guidance and appear to base their strategy around the framework of a firmly hawkish monetary agenda. Barring an economic collapse that forces the Fed to reverse course, gold is likely to continue its downward trend throughout the fourth quarter.
The current downtrend, which started midway through the third quarter, comes after breaking the upswing from lows set in December 2015, suggesting resumption of the long-term dominant decline started in October 2012.
Gold Price Chart: Daily Timeframe (October 2016 to September 2018) (Chart 1)
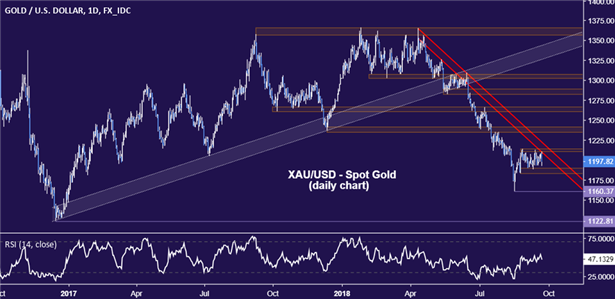
July 2018 looks to have been a decisive month for spot gold prices. The selloff is now struggling to sustain momentum at the $1,200/oz figure, a previously significant inflection point. However, prices would need to reclaim a foothold above $1,300/oz and probably breach range resistance in the $1,357-75 area to invalidate the overall bearish bias.

Related Posts
 4 Cloud Stocks To Consider In 2018
- Disney (DIS) Beats, NewsCorp (NWSA) Misses On Quarterly Earnings
 US Import, Export Prices Tumble For 2nd Month As China Deflation Exports Accelerate
- Goldman Sachs: 5 Hot Stocks Set To Outperform As Wages Rise
 Private Investors Enjoy The Spoils In IPO Deals; Public Investors Left Holding The Bag
- This Is Where The Next EM Crisis Will Start
Leave A Comment