
During a period in which the zero bound no longer is the floor of interest rates, and many central banks continue to ease policy,we have been watching gold a bit closer.
In early January, we noted that the technical pattern warned of breakout. Our first objective was $1110-$1135.
In early February, we updated our view with gold trading near $1150. The charts still looked constructive; we suggested a new target near $1200.

The increasingly precious metal rose to almost $1263.5o on February 11. Since then, it has been carving out a symmetrical triangle pattern, as depicted in the Great Graphic here (that was composed on Bloomberg). The symmetrical triangle is most often a continuation pattern.Occasionally, it is a reversal pattern.
The upper end of the triangle was tested earlier today with the two attempts on $1249. This reinforces the resistance at the top of the triangle. The bottom is near $1215 today, and it rises by about $2.5 a day.
The technical indicators are not particularly helpful at the moment. The RSI is neutral, and the MACDs have turned lower but are moving broadly sideways. The slow stochastics appear to be bottoming. As a point of reference,the 20-day moving average is a little below $1210.
If this triangle is a continuation pattern, the objective is in the $1300-$1320 area. It is not uncommon for there to be initial false breaks from the triangle pattern. On such a move, the $1191 area is interesting.It is the low point since the high was reached on February 11.
If this triangle is a rare reversal pattern, a break of $1180 may be necessary to confirm it. The initial target is $1155 and then $1130.
Although the idea of gold as a safe haven would suggest that it would trade inversely to a risk asset such as the S&P 500. However, using a 60-day rolling correlation between the percentage change of gold and the S&P 50, the correlation was positive for most of the 2011-2013. Gold was treated like another risk asset. From February 2014 through April 2015, the correlation switched from positive to negative (inverse). The correlation went back and forth from April through August and then it turned decisively negative through November.

Related Posts
 What Could Go Wrong With The Economic Forecast In 2018?
 Will Fed Capitulation Forestall Stock Market Crash?
 Multiple Expansion Is Over, Goldman Warns, “US Stocks Will Close 2015 Only 5% Higher”
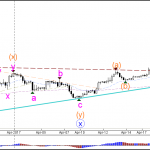 GBP/USD Retracement Returns To 38.2% Fibonacci At 1.2750
 WTI Crude Oil And Natural Gas Forecast – February 4, 2016
- 3 Things: Returns, Net Returns And Expectations


Leave A Comment